 8
8peptides
spectra
0.433 | 0.473
0.169 | 0.237
0.209 | 0.298
0.000 | 0.000
0.000 | 0.000
0.053 | 0.104
0.000 | 0.000
0.000 | 0.000
| Plot | Mito | Lyso | Perox | ER | Golgi | PM | Cytosol | Nucleus | |||||
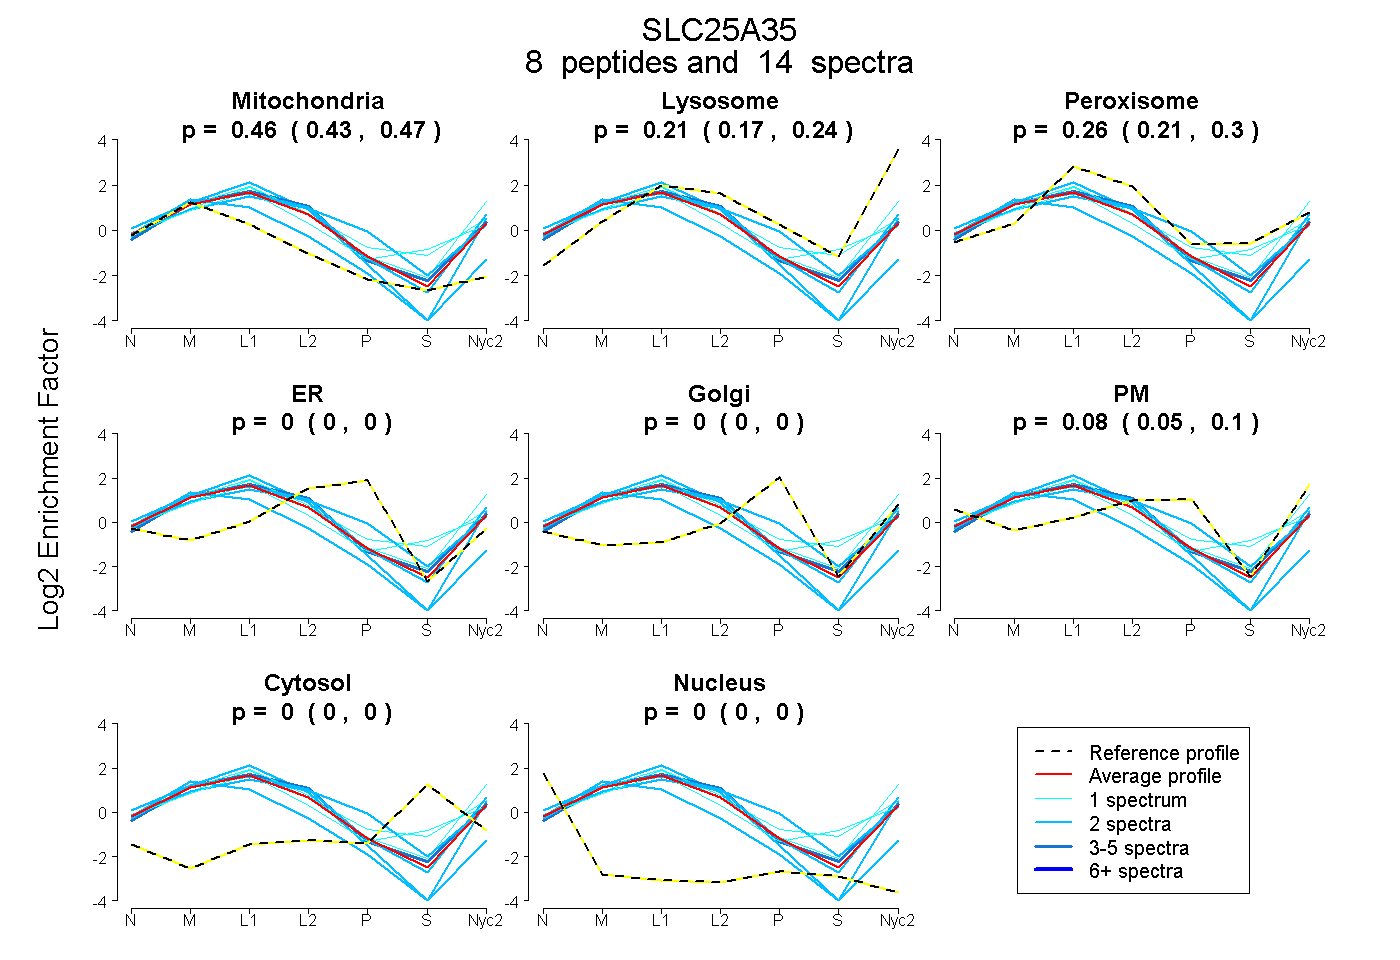
| Expt A |
8 peptides |
14 spectra |
|
0.455 0.433 | 0.473 |
0.206 0.169 | 0.237 |
0.258 0.209 | 0.298 |
0.000 0.000 | 0.000 |
0.000 0.000 | 0.000 |
0.080 0.053 | 0.104 |
0.000 0.000 | 0.000 |
0.000 0.000 | 0.000 |
| 1 spectrum, GAVGGLPR | 0.310 | 0.184 | 0.488 | 0.000 | 0.000 | 0.018 | 0.000 | 0.000 | ||
| 2 spectra, GILDALLQTAR | 0.497 | 0.235 | 0.140 | 0.000 | 0.000 | 0.128 | 0.000 | 0.000 | ||
| 3 spectra, HGLVGLWR | 0.428 | 0.228 | 0.344 | 0.000 | 0.000 | 0.000 | 0.000 | 0.000 | ||
| 1 spectrum, SFYSTYAK | 0.350 | 0.095 | 0.509 | 0.000 | 0.000 | 0.000 | 0.047 | 0.000 | ||
| 2 spectra, NVFHAFFTIGK | 0.436 | 0.313 | 0.180 | 0.000 | 0.000 | 0.071 | 0.000 | 0.000 | ||
| 2 spectra, TEGLFGMYK | 0.854 | 0.054 | 0.000 | 0.000 | 0.000 | 0.092 | 0.000 | 0.000 | ||
| 2 spectra, LYNQPTDTR | 0.266 | 0.072 | 0.359 | 0.108 | 0.000 | 0.196 | 0.000 | 0.000 | ||
| 1 spectrum, LGTYGLAESGGYLR | 0.364 | 0.407 | 0.215 | 0.000 | 0.000 | 0.013 | 0.000 | 0.000 |
| Plot | Mito | Lyso or Perox | ER | Golgi | PM | Cytosol | Nucleus | ||||||
| Expt B |
2 peptides |
3 spectra |
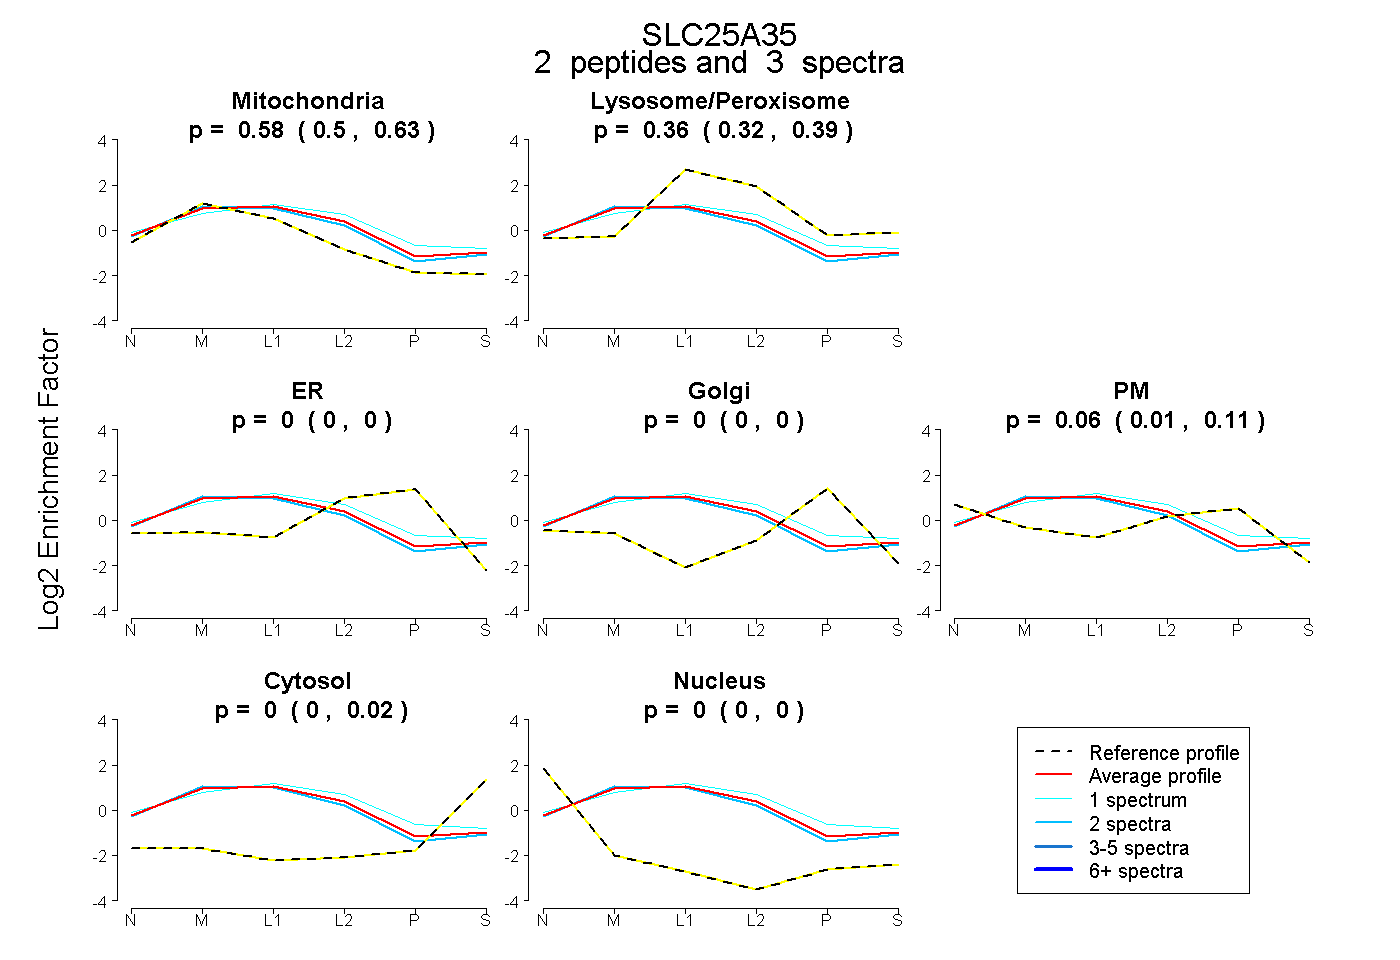 |
0.578 0.502 | 0.631 |
0.358 0.324 | 0.388 |
0.000 0.000 | 0.000 |
0.000 0.000 | 0.000 |
0.064 0.006 | 0.112 |
0.000 0.000 | 0.021 |
0.000 0.000 | 0.000 |
|||
| Plot | Lyso | Other | |||||||||||
| Expt C |
11 peptides |
44 spectra |
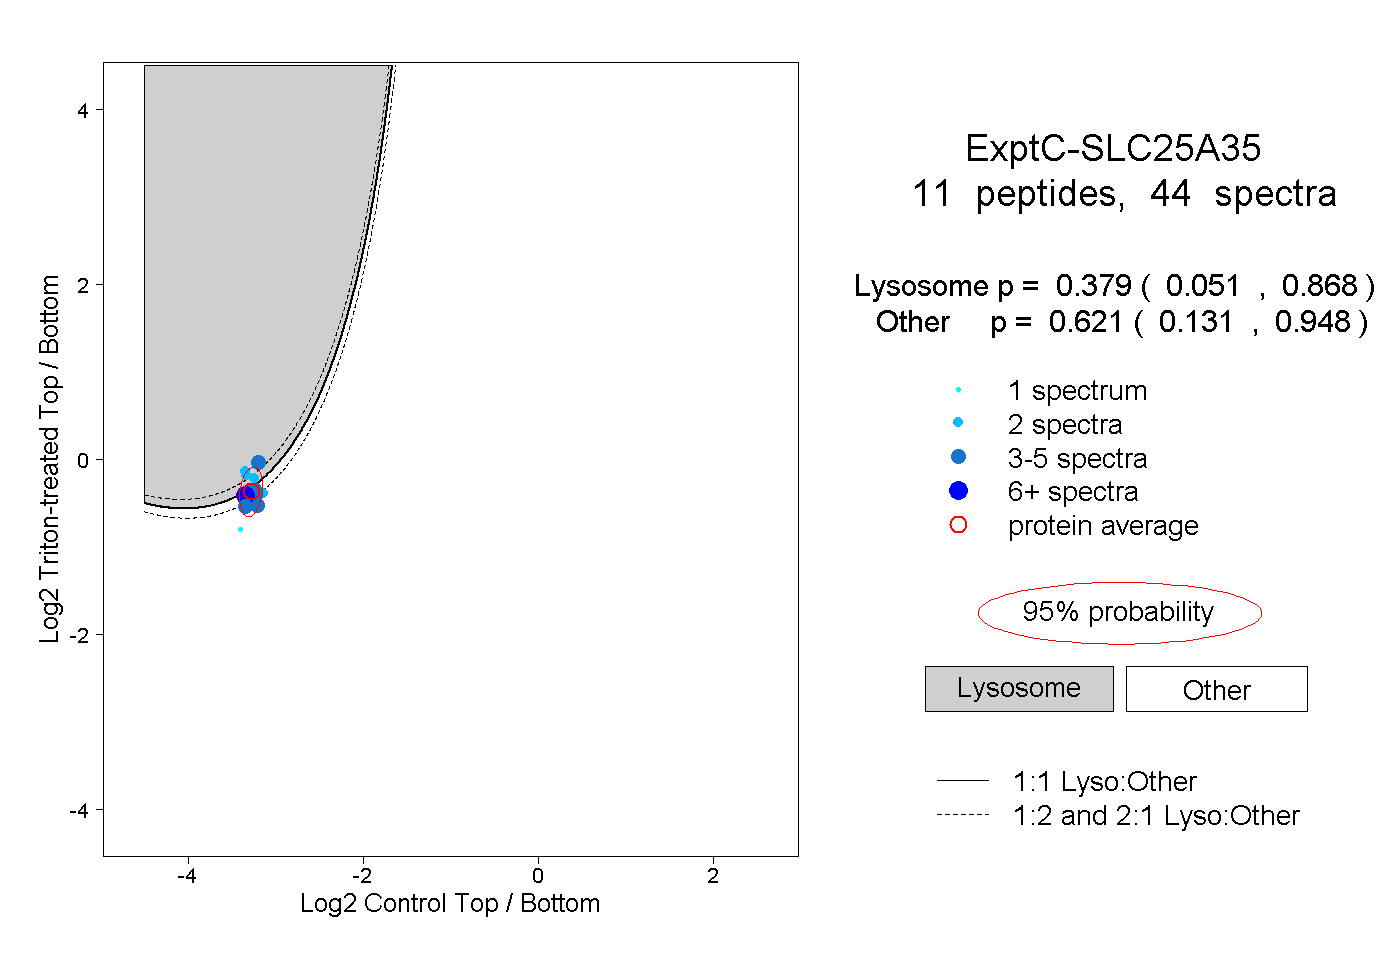 |
0.379 0.051 | 0.868 |
0.621 0.131 | 0.948 |
||||||||
| Plot | Lyso | Other | |||||||||||
| Expt D |
2 peptides |
4 spectra |
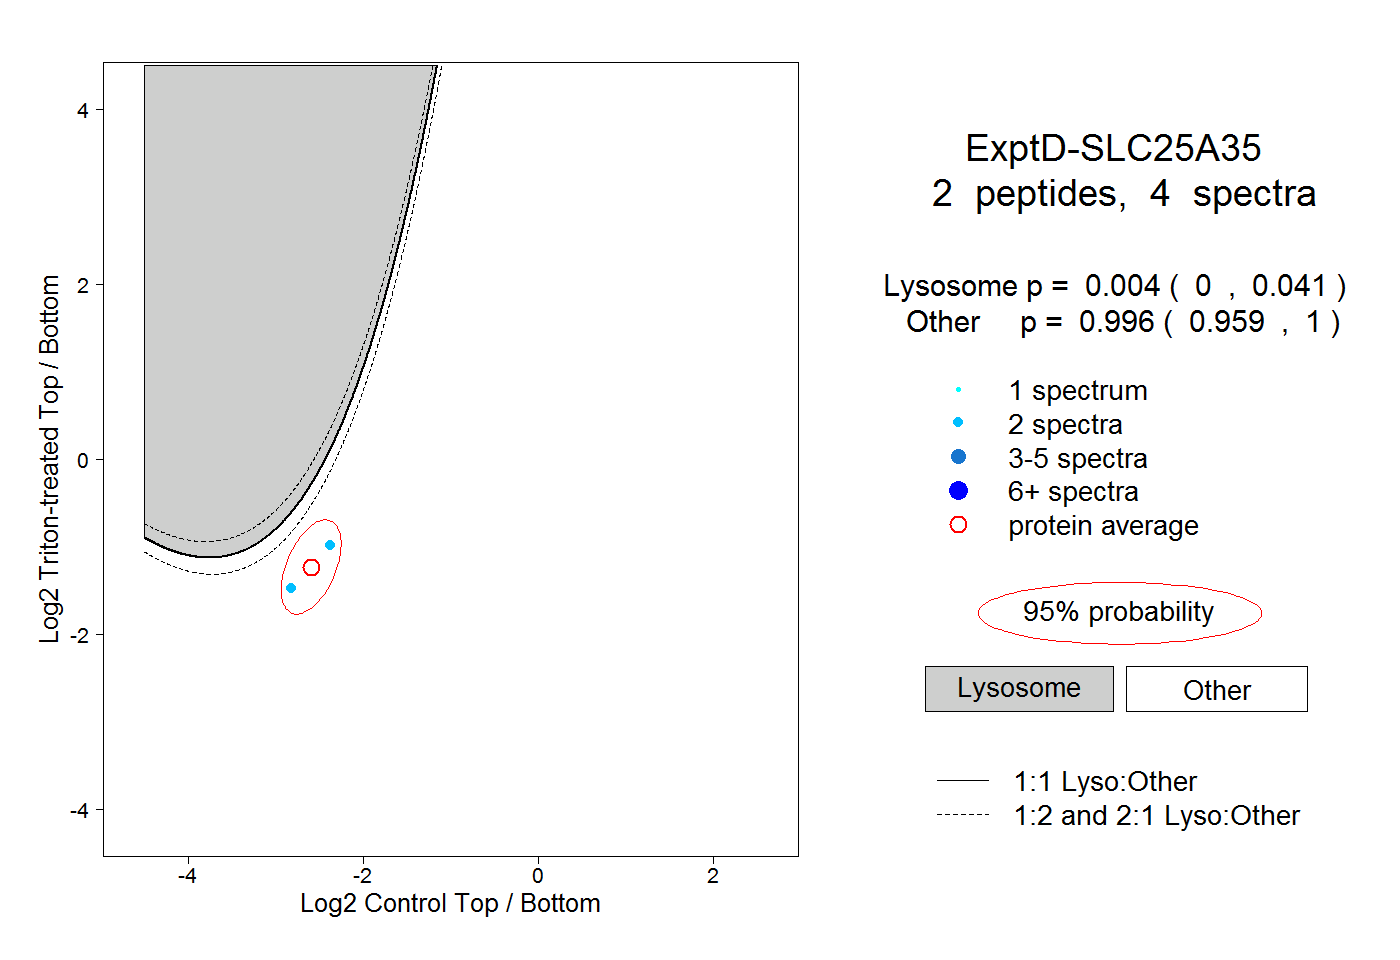 |
0.004 0.000 | 0.041 |
0.996 0.959 | 1.000 |