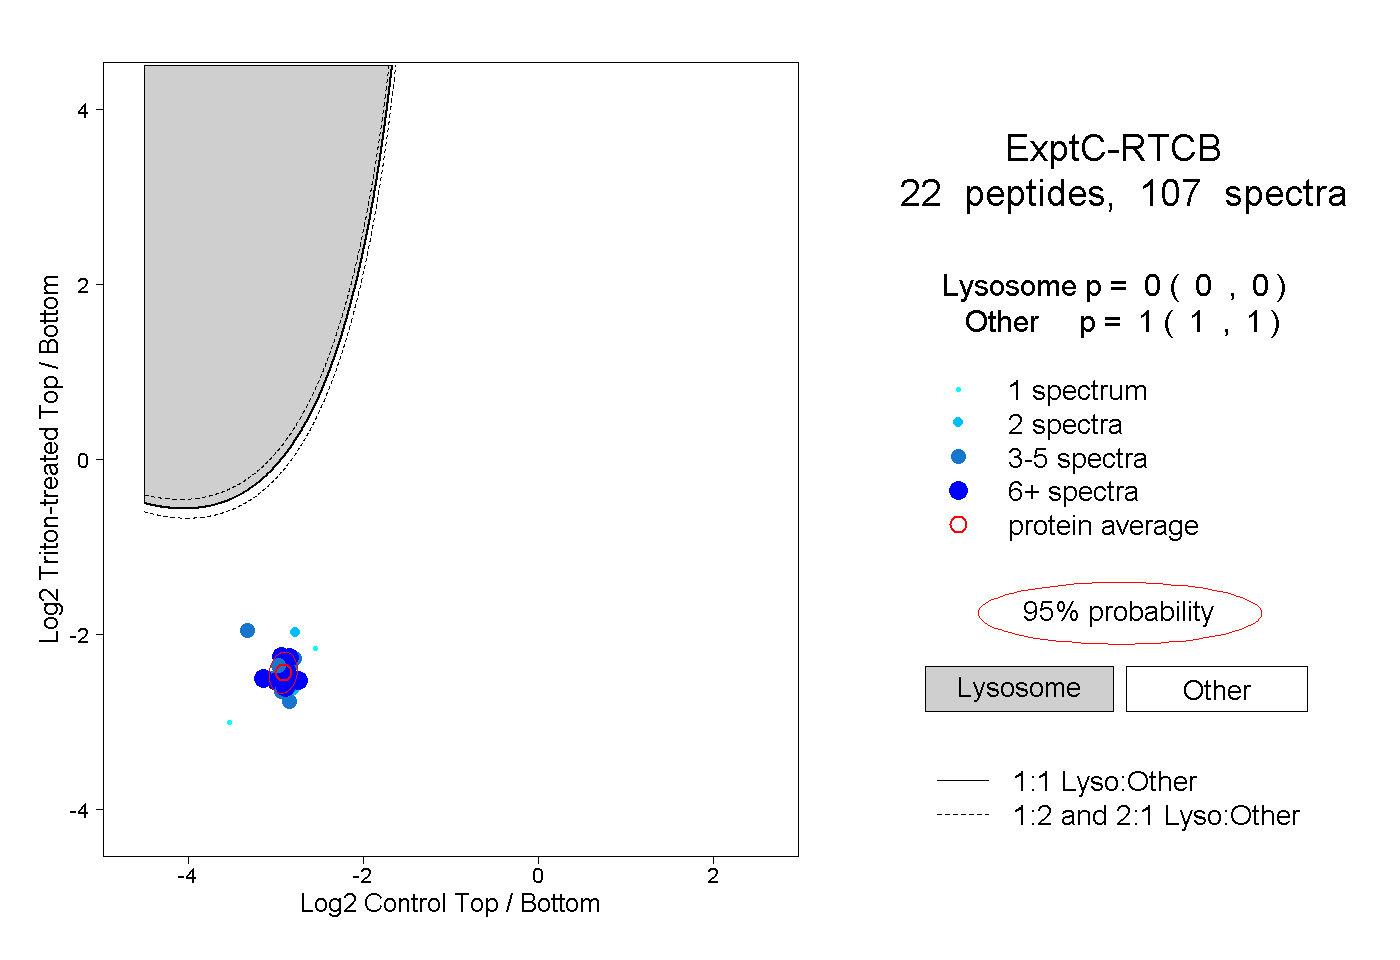
22
22peptides
spectra
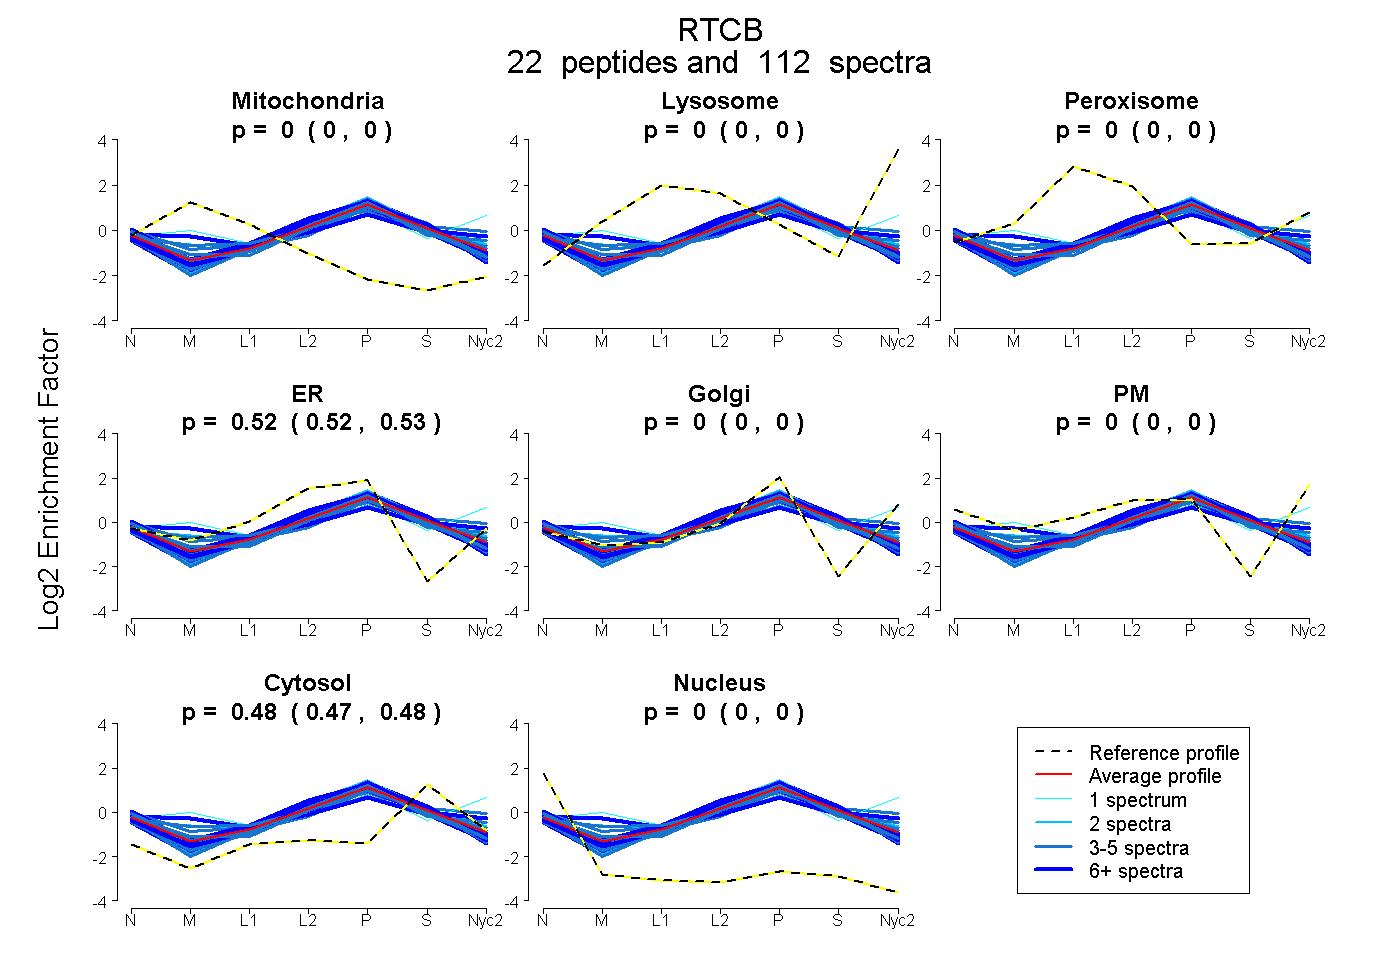
0.000 | 0.000
0.000 | 0.000
0.000 | 0.000
0.523 | 0.526
0.000 | 0.000
0.000 | 0.000
0.474 | 0.477
0.000 | 0.000
11peptides
spectra
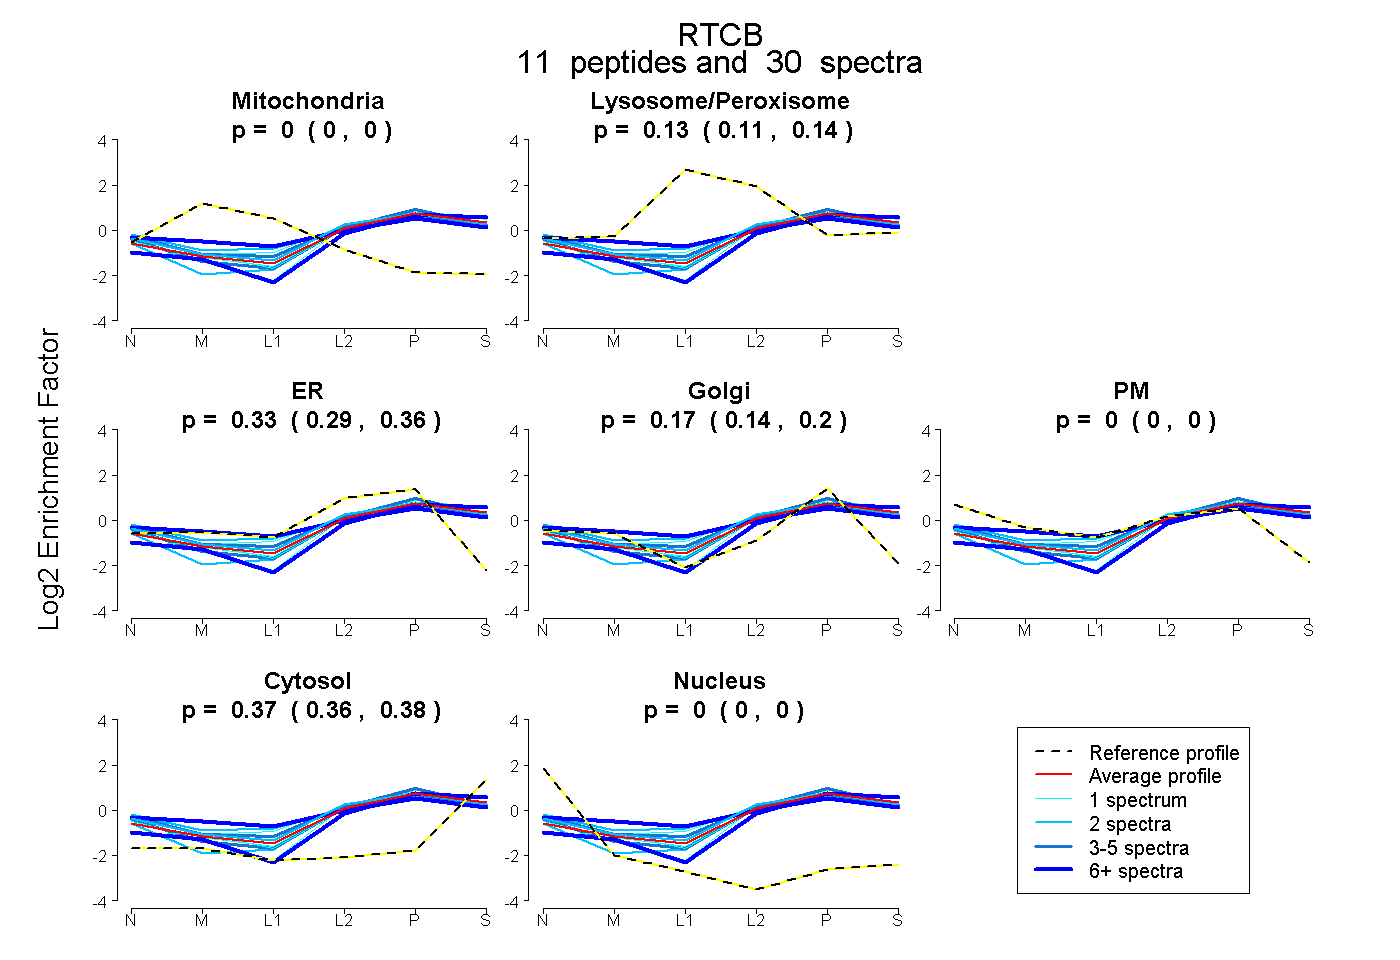
0.000 | 0.000
0.105 | 0.141
0.290 | 0.360
0.143 | 0.197
0.000 | 0.000
0.362 | 0.383
0.000 | 0.000