 8
8peptides
spectra
0.000 | 0.000
0.000 | 0.006
0.055 | 0.074
0.000 | 0.000
0.143 | 0.159
0.000 | 0.000
0.773 | 0.789
0.000 | 0.000
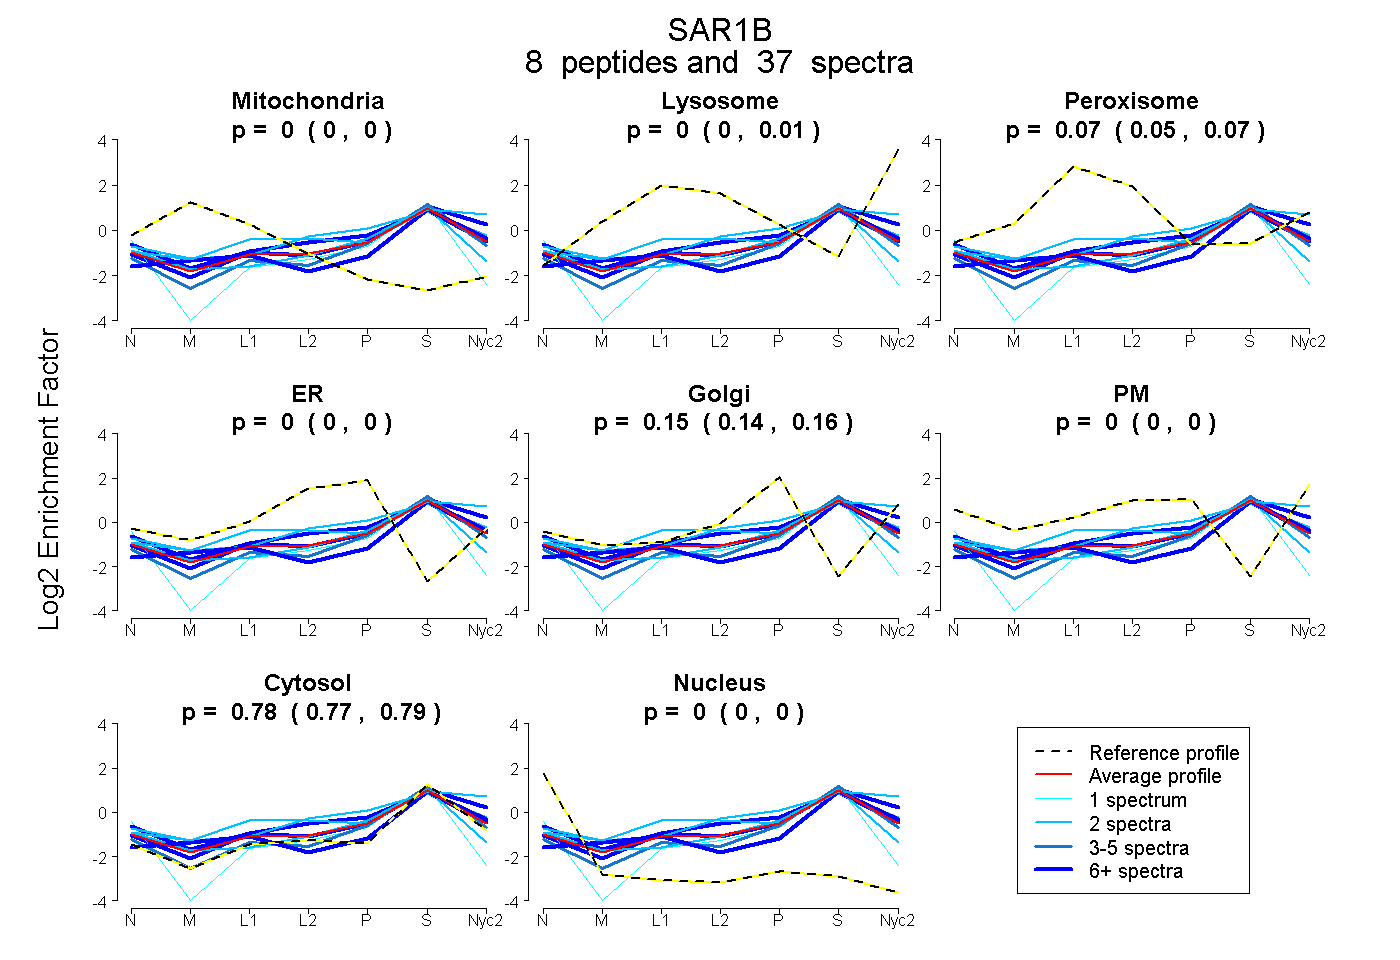
| Plot | Mito | Lyso | Perox | ER | Golgi | PM | Cytosol | Nucleus | |||||
| Expt A |
8 peptides |
37 spectra |
|
0.000 0.000 | 0.000 |
0.000 0.000 | 0.006 |
0.066 0.055 | 0.074 |
0.000 0.000 | 0.000 |
0.152 0.143 | 0.159 |
0.000 0.000 | 0.000 |
0.782 0.773 | 0.789 |
0.000 0.000 | 0.000 |
| 2 spectra, QGYGEGFR | 0.000 | 0.000 | 0.114 | 0.027 | 0.213 | 0.026 | 0.620 | 0.000 | ||
| 11 spectra, IDRPEAISEER | 0.000 | 0.000 | 0.060 | 0.098 | 0.033 | 0.094 | 0.715 | 0.000 | ||
| 8 spectra, TTLLHMLK | 0.102 | 0.075 | 0.000 | 0.000 | 0.000 | 0.000 | 0.823 | 0.000 | ||
| 5 spectra, LVFLGLDNAGK | 0.000 | 0.000 | 0.000 | 0.000 | 0.098 | 0.000 | 0.902 | 0.000 | ||
| 1 spectrum, GSVSIK | 0.000 | 0.000 | 0.000 | 0.000 | 0.000 | 0.000 | 0.820 | 0.180 | ||
| 2 spectra, WMAQYID | 0.000 | 0.278 | 0.020 | 0.000 | 0.000 | 0.053 | 0.649 | 0.000 | ||
| 6 spectra, EMFGLYGQTTGK | 0.000 | 0.124 | 0.000 | 0.000 | 0.096 | 0.000 | 0.780 | 0.000 | ||
| 2 spectra, NYLPAINGIVFLVDCADHER | 0.008 | 0.000 | 0.000 | 0.124 | 0.023 | 0.000 | 0.808 | 0.038 |
| Plot | Mito | Lyso or Perox | ER | Golgi | PM | Cytosol | Nucleus | ||||||
| Expt B |
3 peptides |
12 spectra |
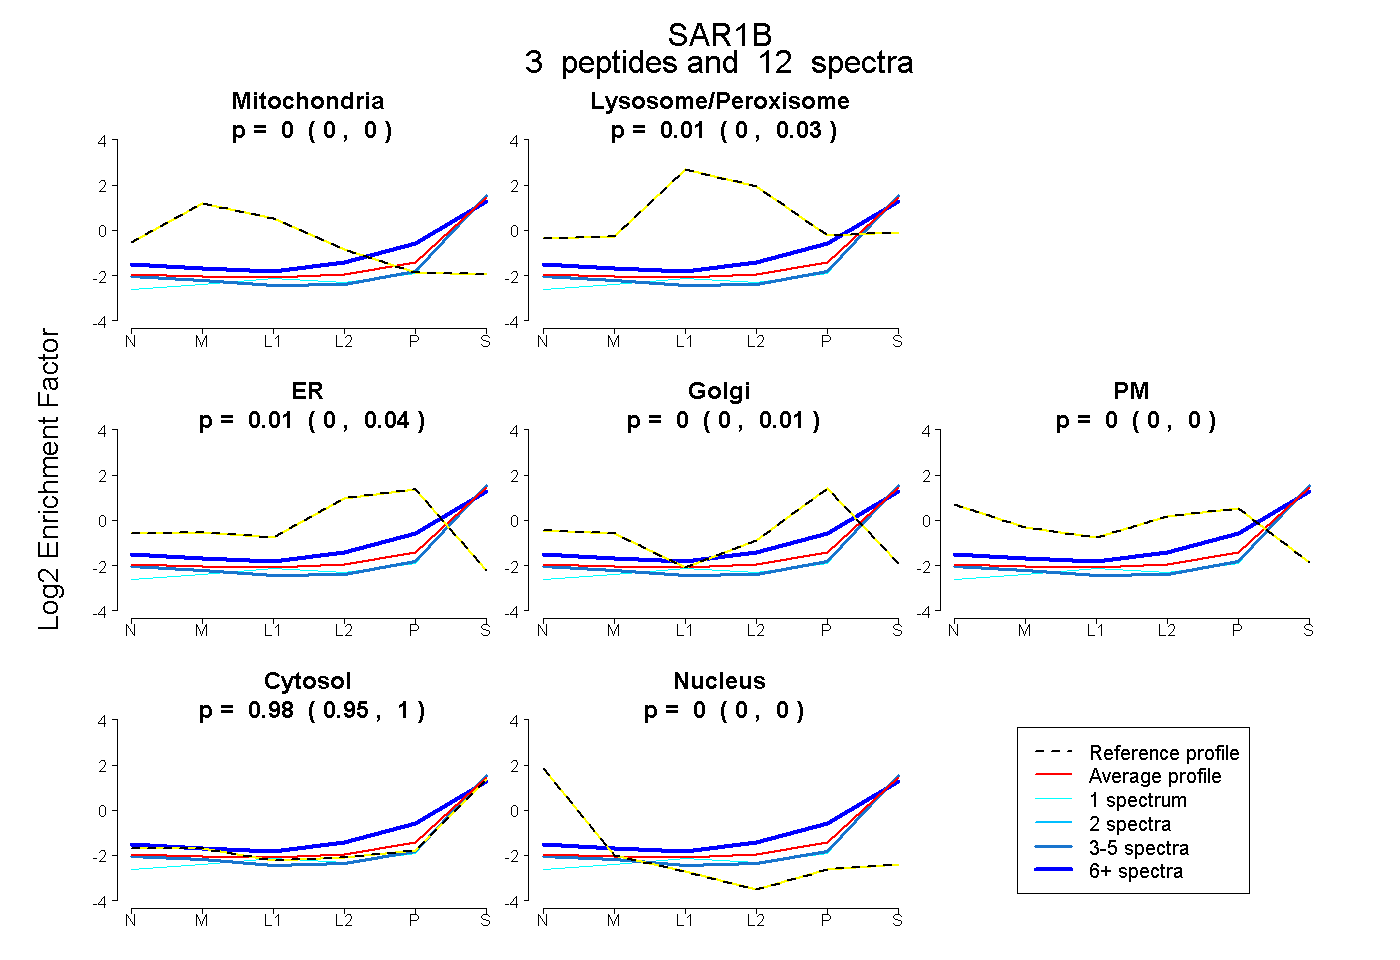 |
0.000 0.000 | 0.000 |
0.008 0.000 | 0.029 |
0.011 0.000 | 0.036 |
0.000 0.000 | 0.010 |
0.000 0.000 | 0.000 |
0.981 0.950 | 1.000 |
0.000 0.000 | 0.000 |
|||
| Plot | Lyso | Other | |||||||||||
| Expt C |
2 peptides |
23 spectra |
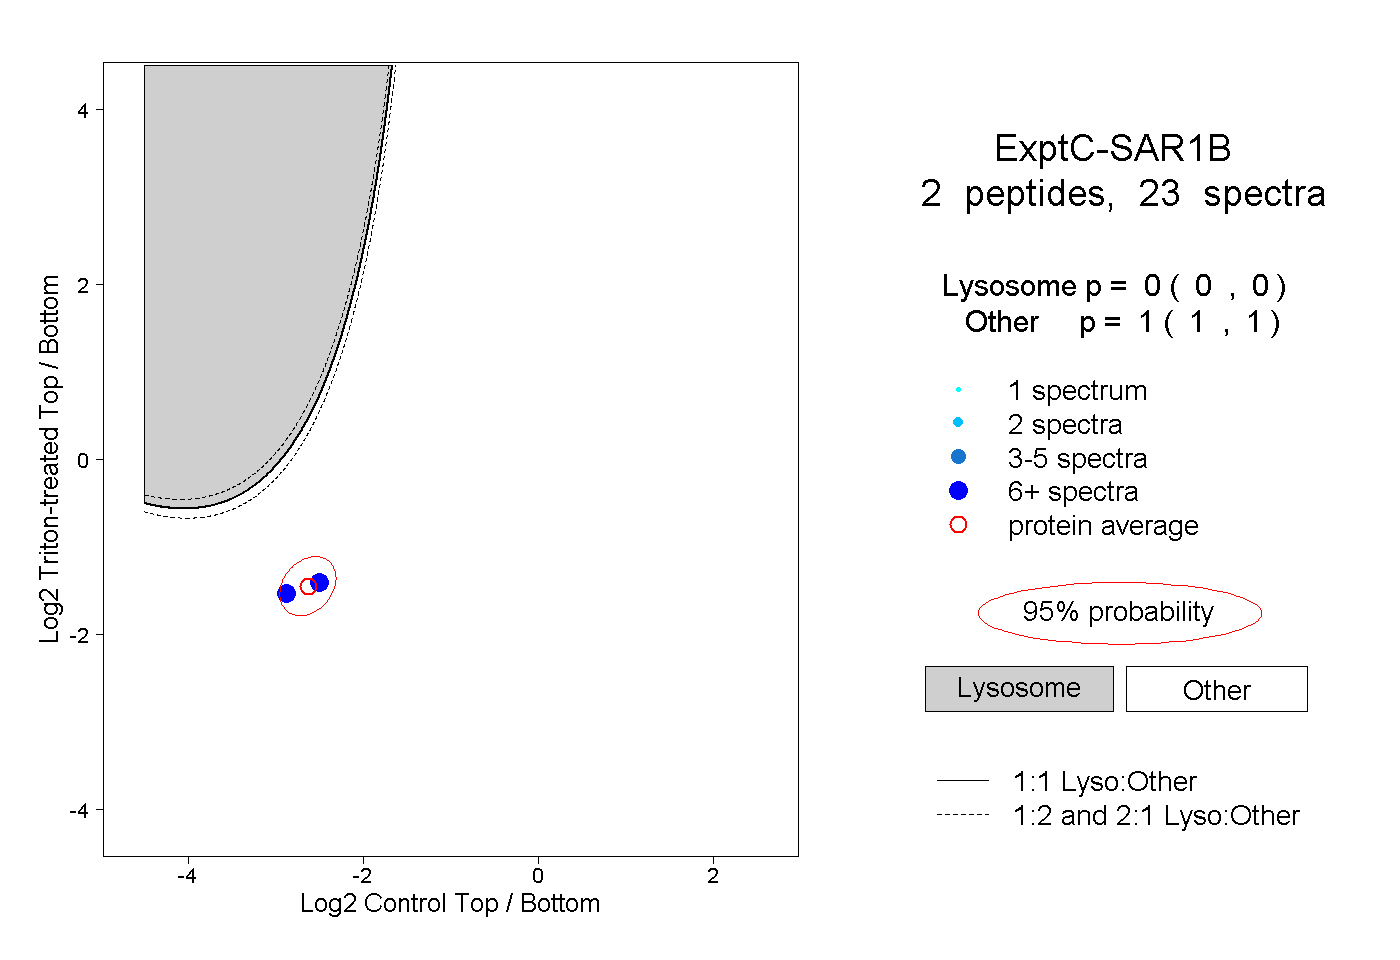 |
0.000 0.000 | 0.000 |
1.000 1.000 | 1.000 |
||||||||
| Plot | Lyso | Other | |||||||||||
| Expt D |
1 peptide |
3 spectra |
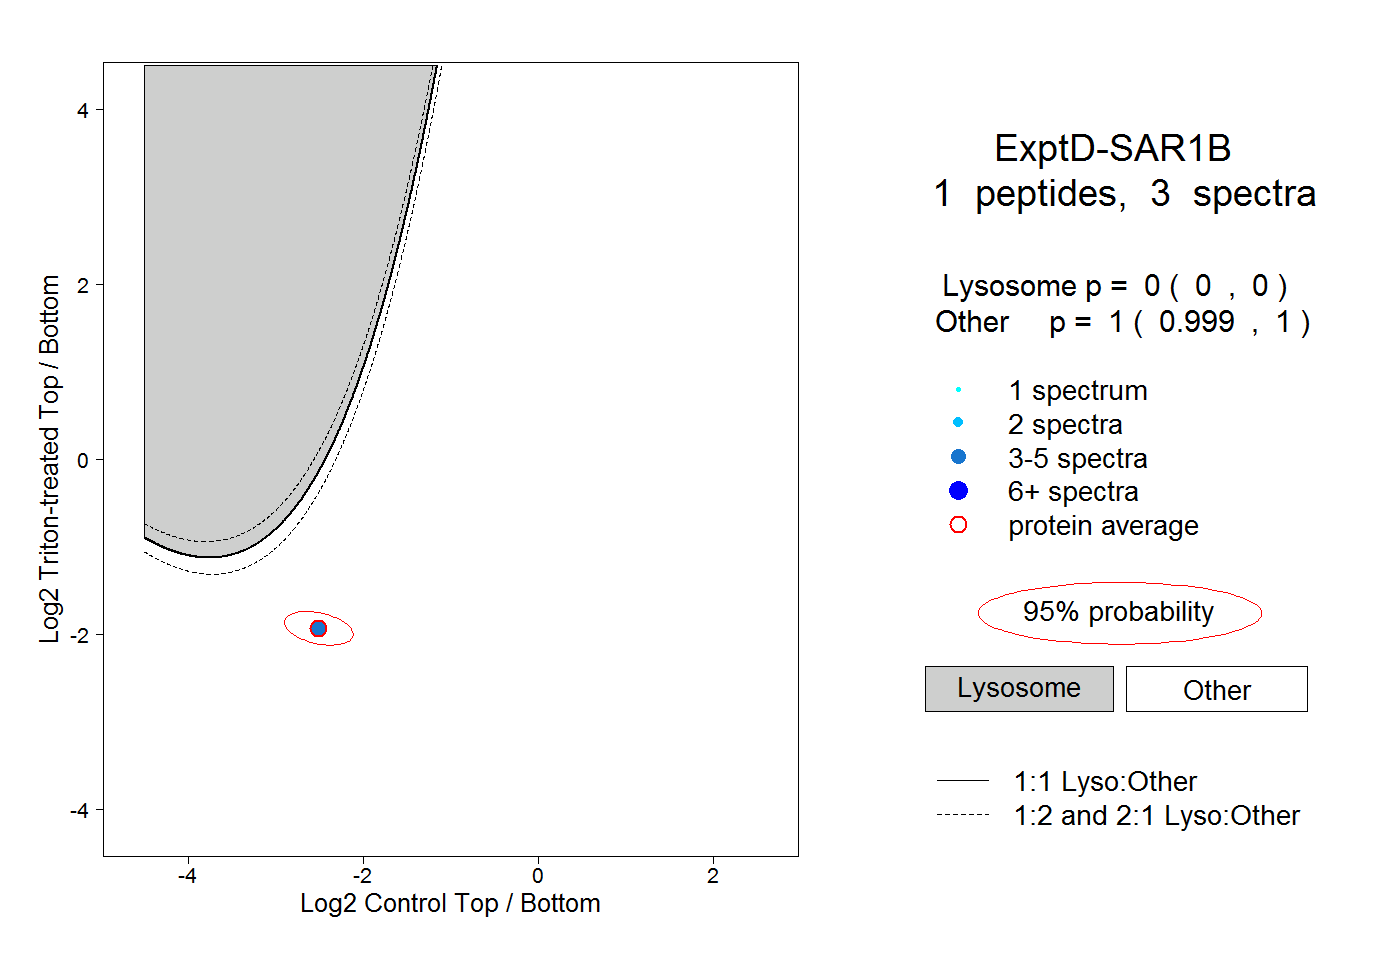 |
0.000 0.000 | 0.000 |
1.000 0.999 | 1.000 |