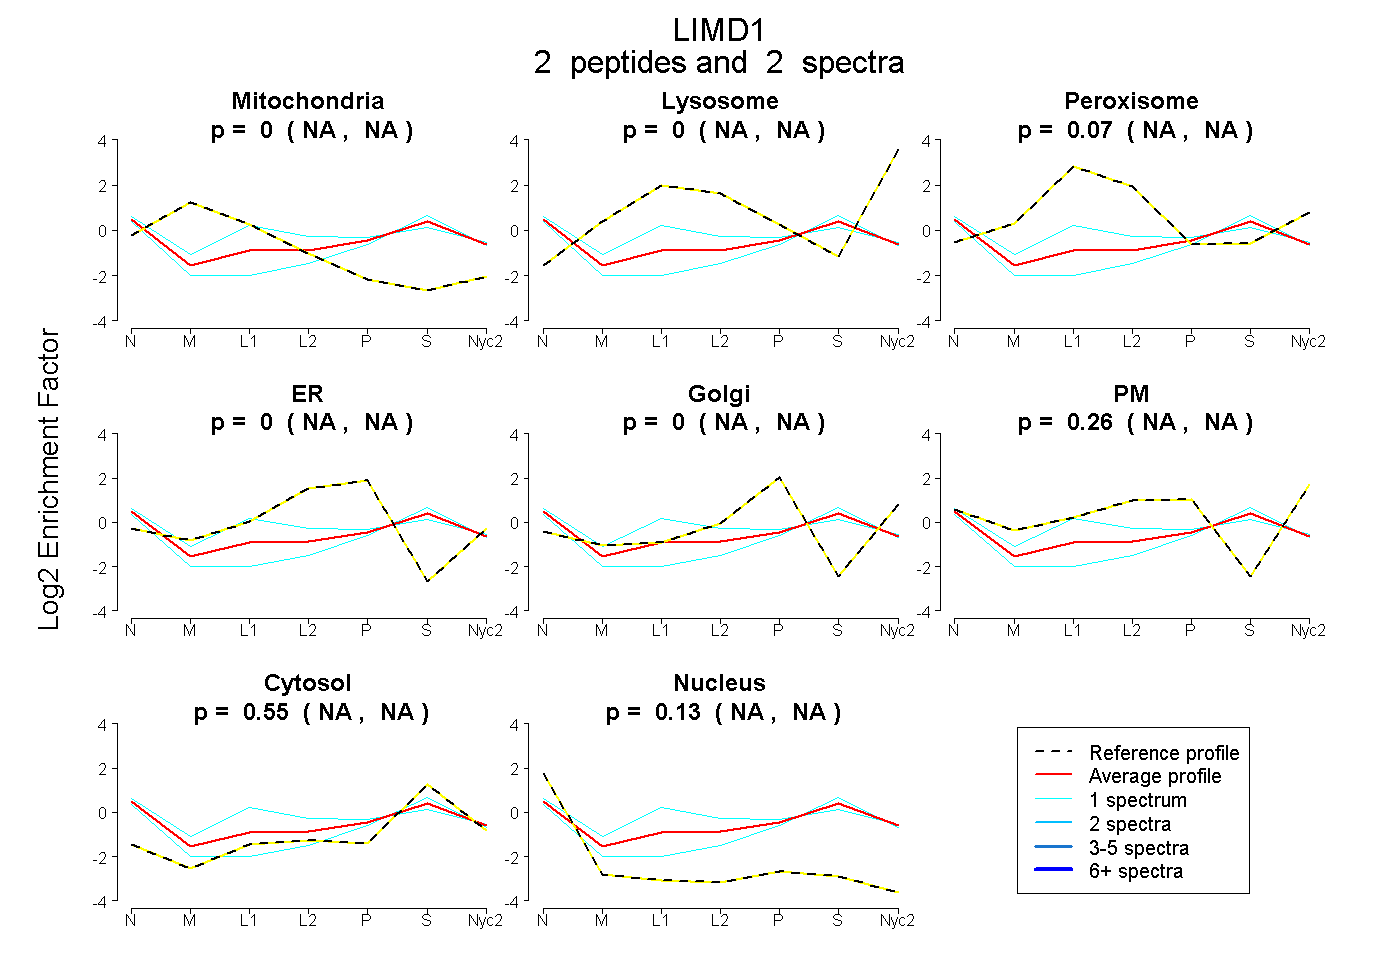
 2
2peptides
spectra
NA | NA
NA | NA
NA | NA
NA | NA
NA | NA
NA | NA
NA | NA
NA | NA
| Plot | Mito | Lyso | Perox | ER | Golgi | PM | Cytosol | Nucleus | |||||
| Expt A |
2 peptides |
2 spectra |
|
0.000 NA | NA |
0.000 NA | NA |
0.067 NA | NA |
0.000 NA | NA |
0.000 NA | NA |
0.258 NA | NA |
0.546 NA | NA |
0.129 NA | NA |
| 1 spectrum, DSSLGYEAPGR | 0.000 | 0.000 | 0.340 | 0.000 | 0.000 | 0.171 | 0.341 | 0.148 | ||
| 1 spectrum, EMDAHPK | 0.000 | 0.000 | 0.000 | 0.000 | 0.068 | 0.113 | 0.654 | 0.166 |
| Plot | Lyso | Other | |||||||||||
| Expt C |
1 peptide |
2 spectra |
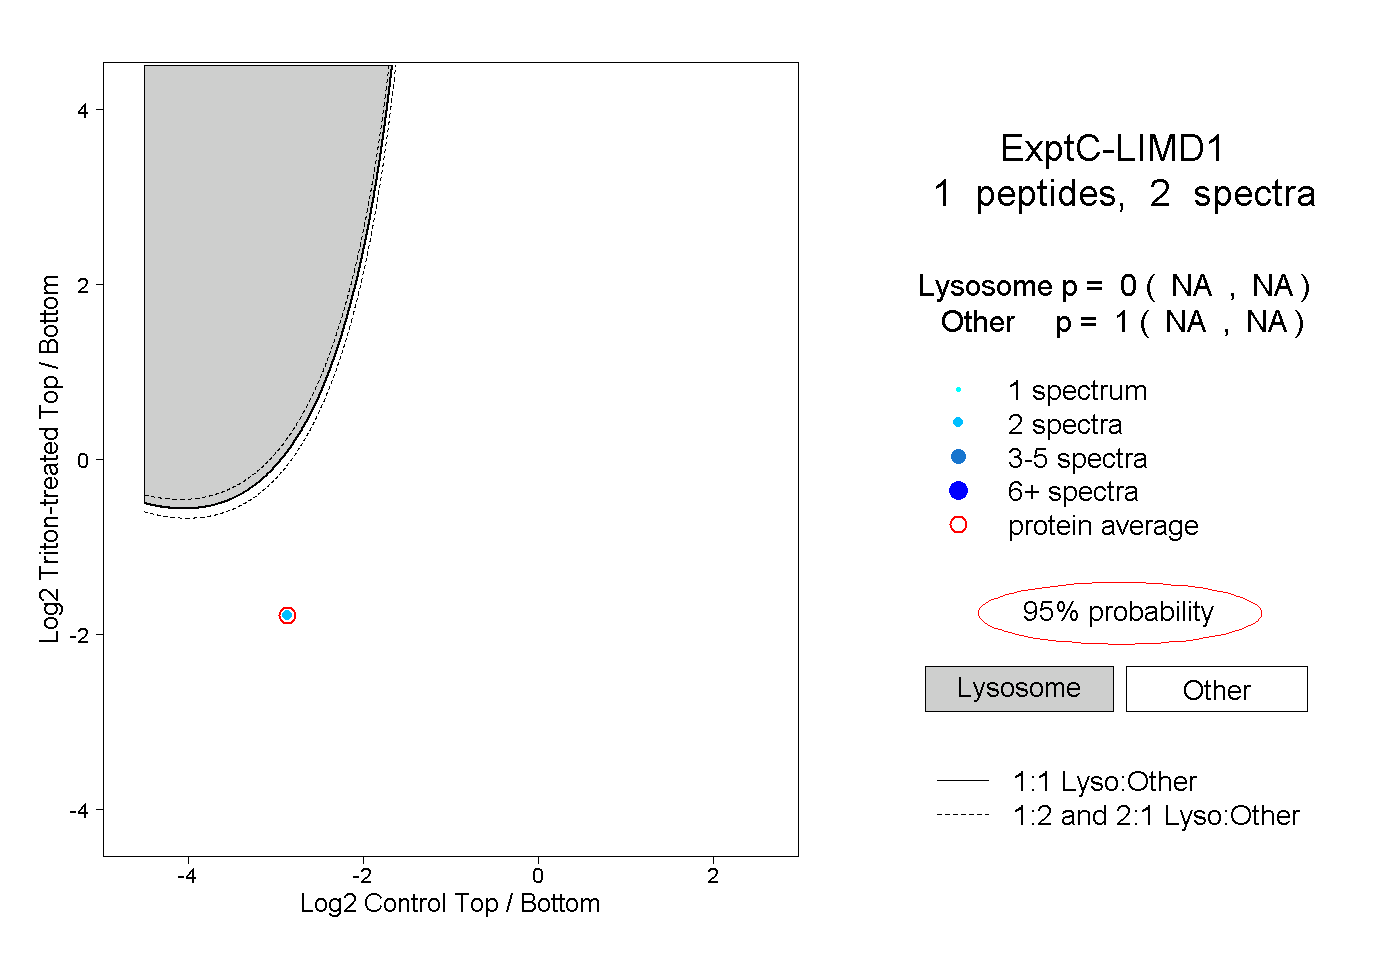 |
0.000 NA | NA |
1.000 NA | NA |