 7
7peptides
spectra
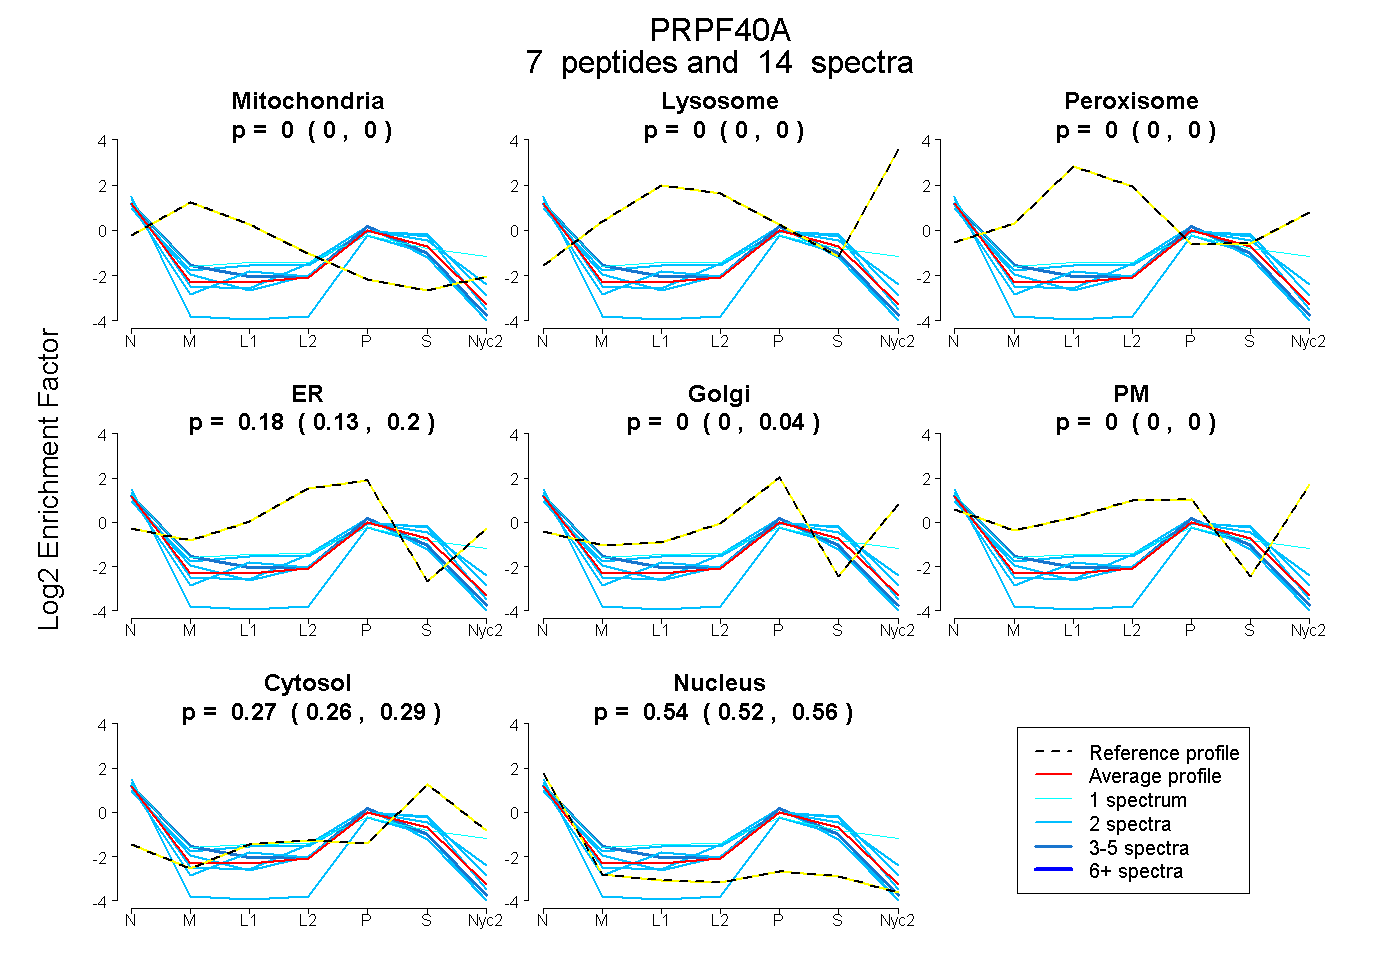
0.000 | 0.000
0.000 | 0.000
0.000 | 0.000
0.131 | 0.201
0.000 | 0.041
0.000 | 0.000
0.255 | 0.288
0.523 | 0.556
| Plot | Mito | Lyso | Perox | ER | Golgi | PM | Cytosol | Nucleus | |||||
| Expt A |
7 peptides |
14 spectra |
|
0.000 0.000 | 0.000 |
0.000 0.000 | 0.000 |
0.000 0.000 | 0.000 |
0.185 0.131 | 0.201 |
0.000 0.000 | 0.041 |
0.000 0.000 | 0.000 |
0.274 0.255 | 0.288 |
0.541 0.523 | 0.556 |
| 2 spectra, QAFNAYK | 0.000 | 0.000 | 0.000 | 0.137 | 0.000 | 0.000 | 0.366 | 0.497 | ||
| 3 spectra, MTSTTR | 0.000 | 0.000 | 0.000 | 0.260 | 0.000 | 0.000 | 0.166 | 0.574 | ||
| 1 spectrum, STTLDAGNIK | 0.000 | 0.000 | 0.000 | 0.000 | 0.073 | 0.298 | 0.283 | 0.346 | ||
| 2 spectra, EPAFEDITLESER | 0.000 | 0.000 | 0.000 | 0.000 | 0.000 | 0.000 | 0.181 | 0.819 | ||
| 2 spectra, FYVEDLK | 0.000 | 0.000 | 0.000 | 0.255 | 0.000 | 0.000 | 0.124 | 0.621 | ||
| 2 spectra, LAFNSLLEK | 0.000 | 0.000 | 0.000 | 0.277 | 0.000 | 0.000 | 0.350 | 0.373 | ||
| 2 spectra, YSALAK | 0.000 | 0.000 | 0.000 | 0.052 | 0.115 | 0.000 | 0.376 | 0.457 |
| Plot | Mito | Lyso or Perox | ER | Golgi | PM | Cytosol | Nucleus | ||||||
| Expt B |
1 peptide |
1 spectrum |
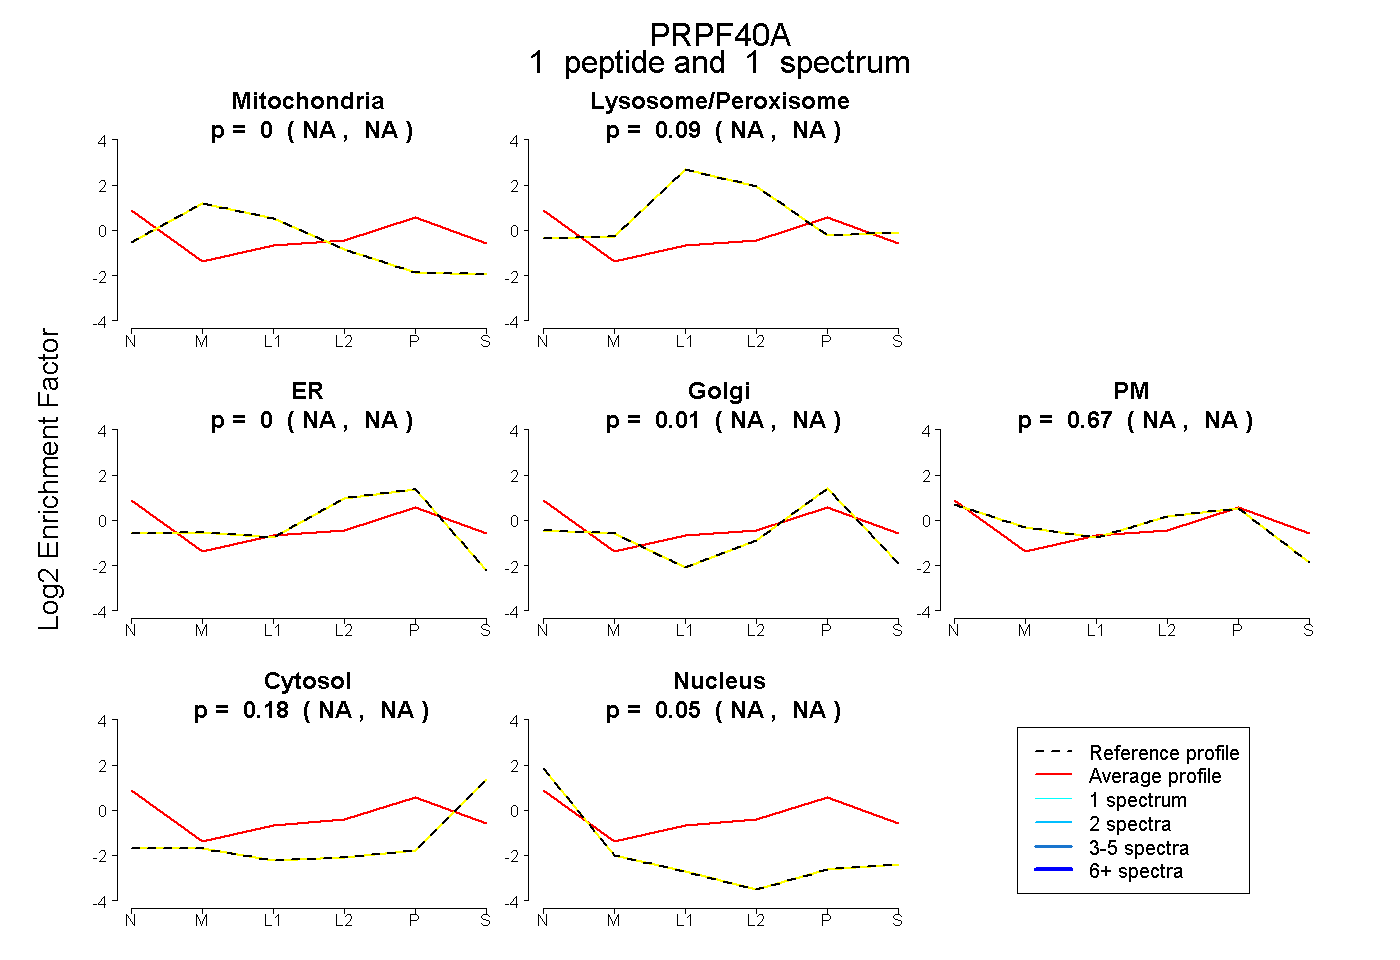 |
0.000 NA | NA |
0.094 NA | NA |
0.000 NA | NA |
0.007 NA | NA |
0.673 NA | NA |
0.175 NA | NA |
0.050 NA | NA |