13
13peptides
spectra
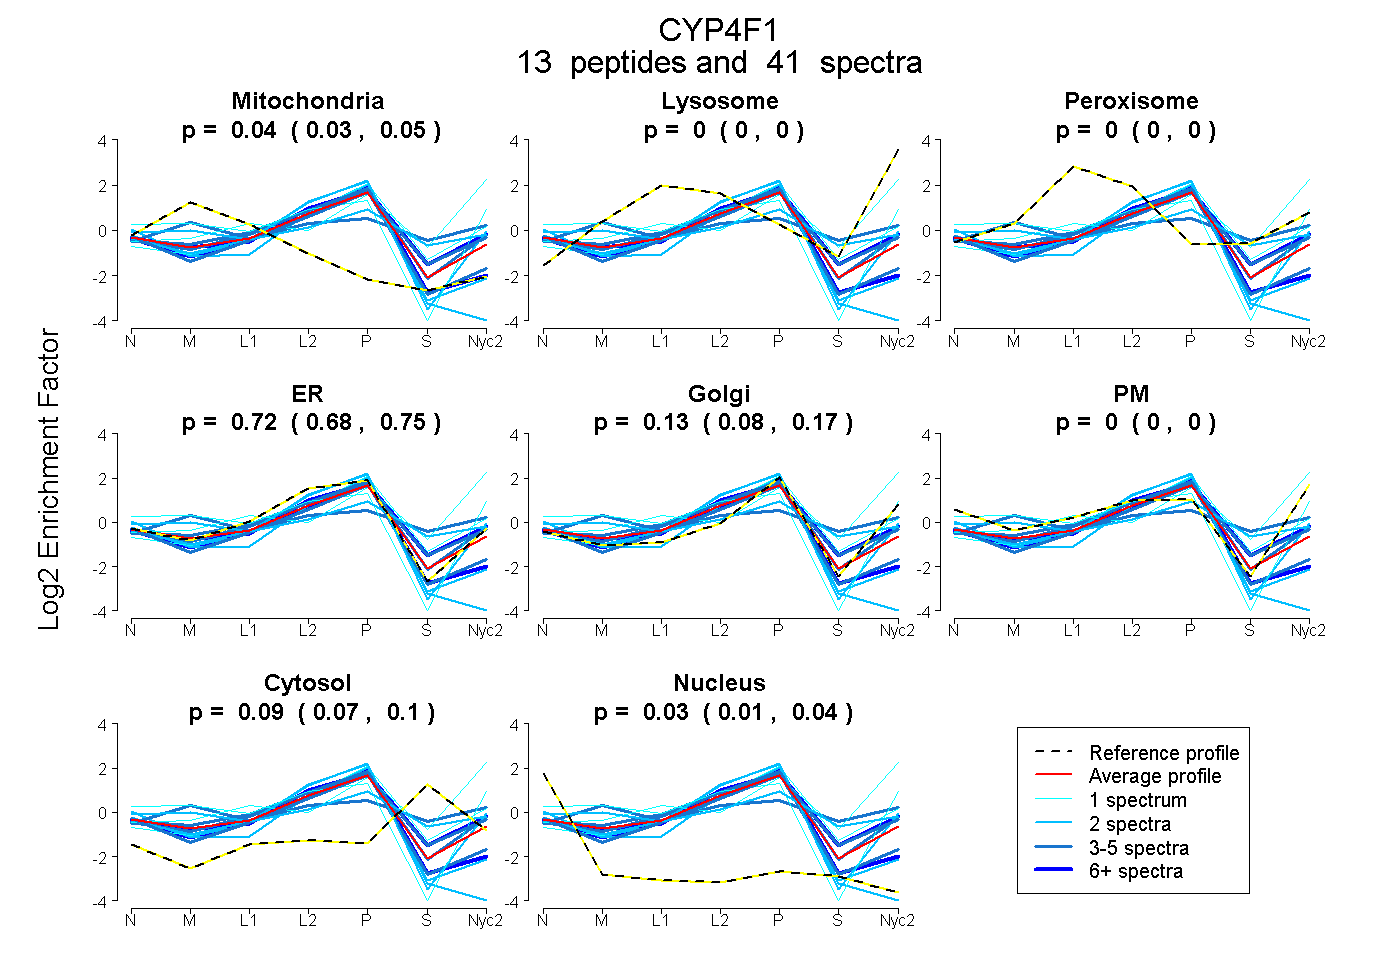
0.026 | 0.046
0.000 | 0.000
0.000 | 0.000
0.683 | 0.749
0.084 | 0.167
0.000 | 0.000
0.073 | 0.103
0.013 | 0.036
8peptides
spectra
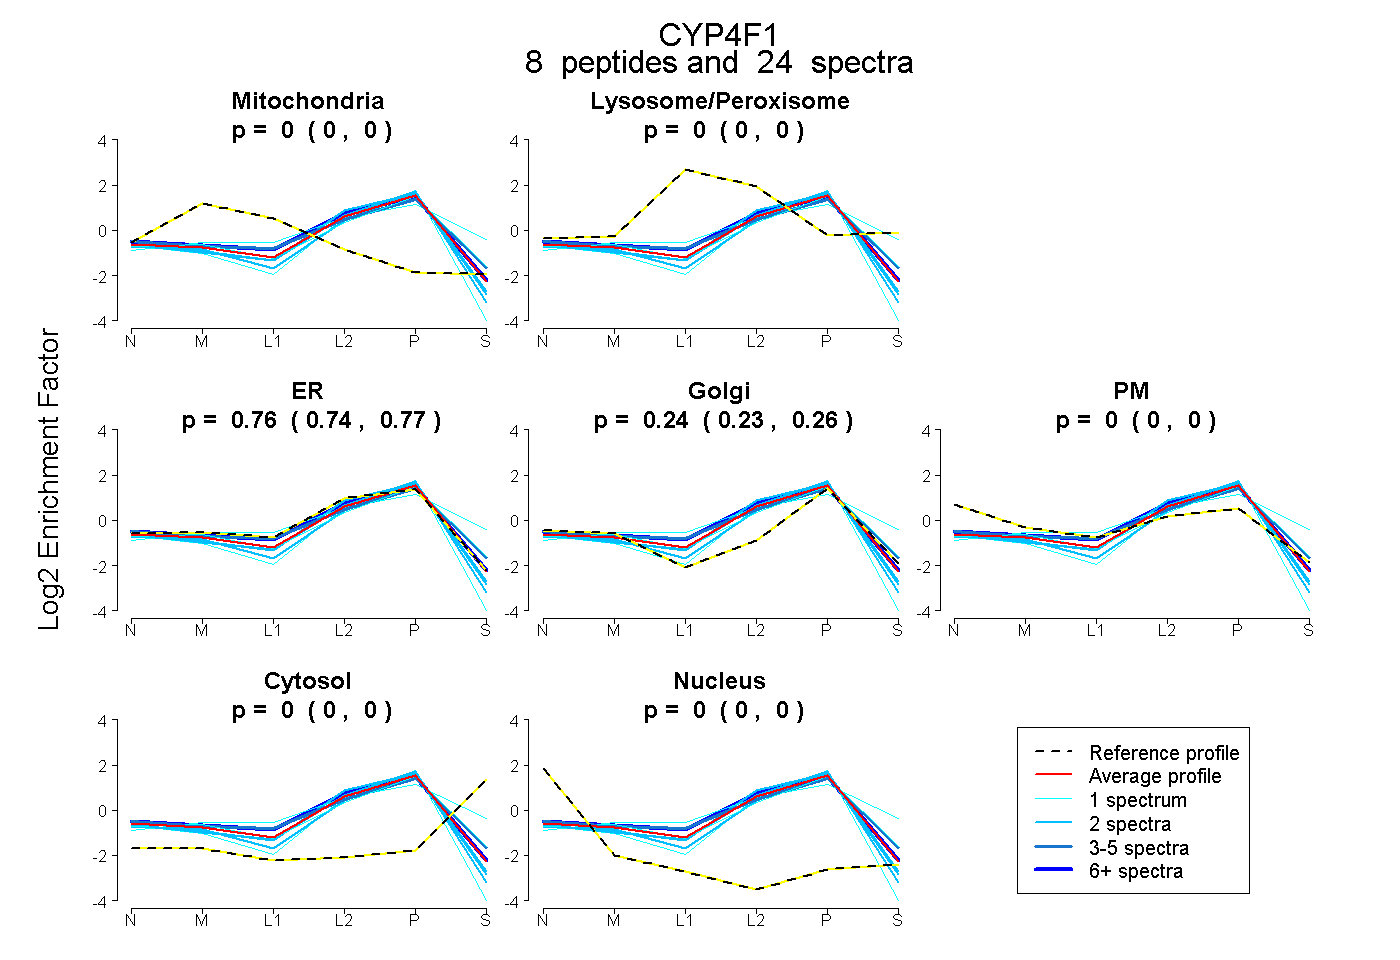
0.000 | 0.000
0.000 | 0.000
0.738 | 0.770
0.227 | 0.259
0.000 | 0.000
0.000 | 0.000
0.000 | 0.000
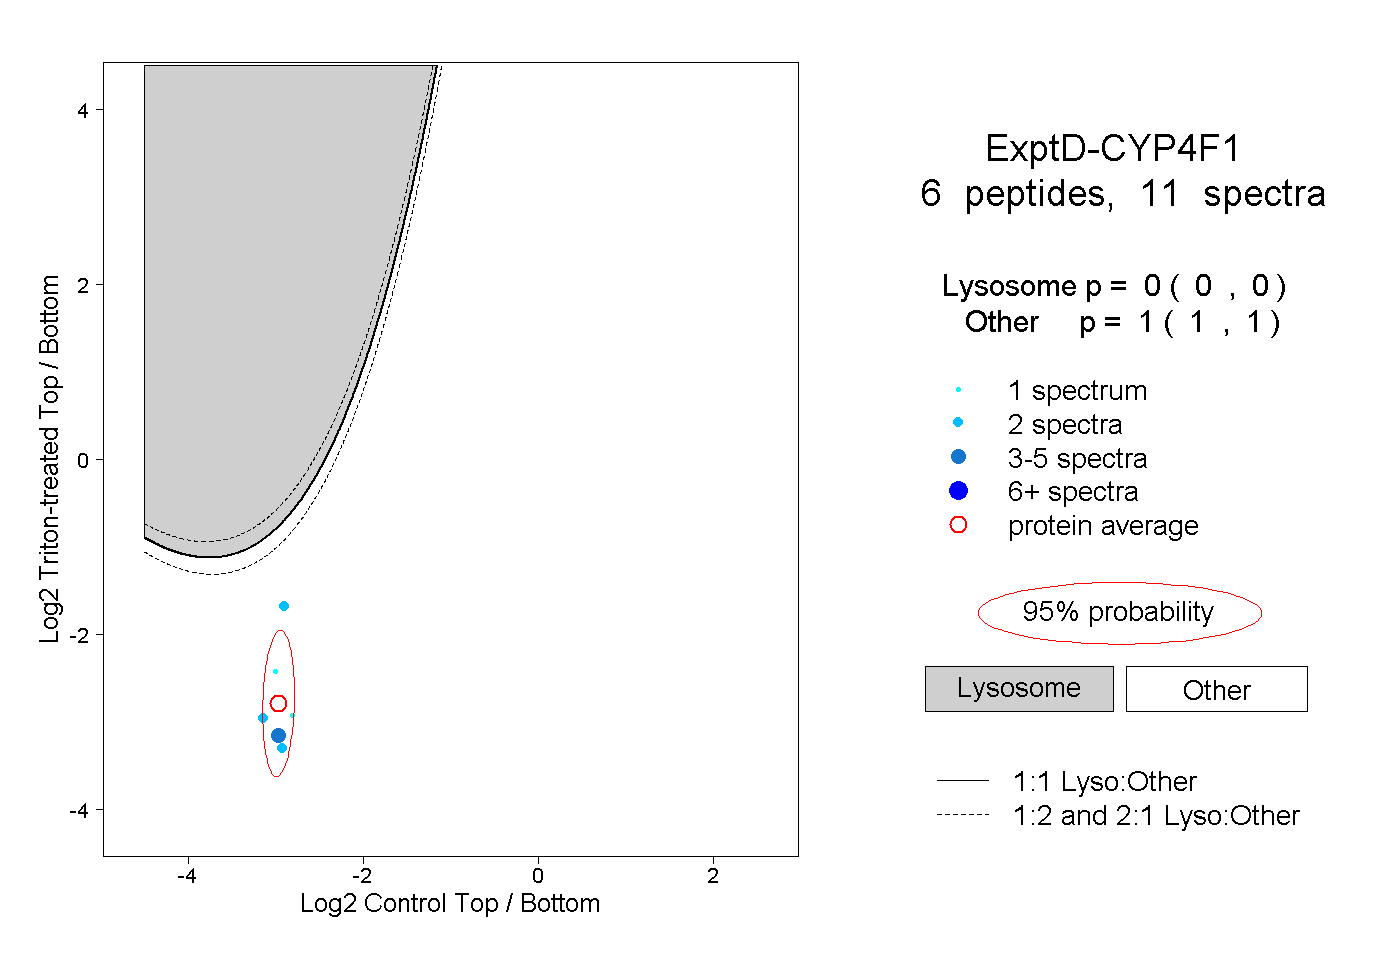
19peptides
spectra
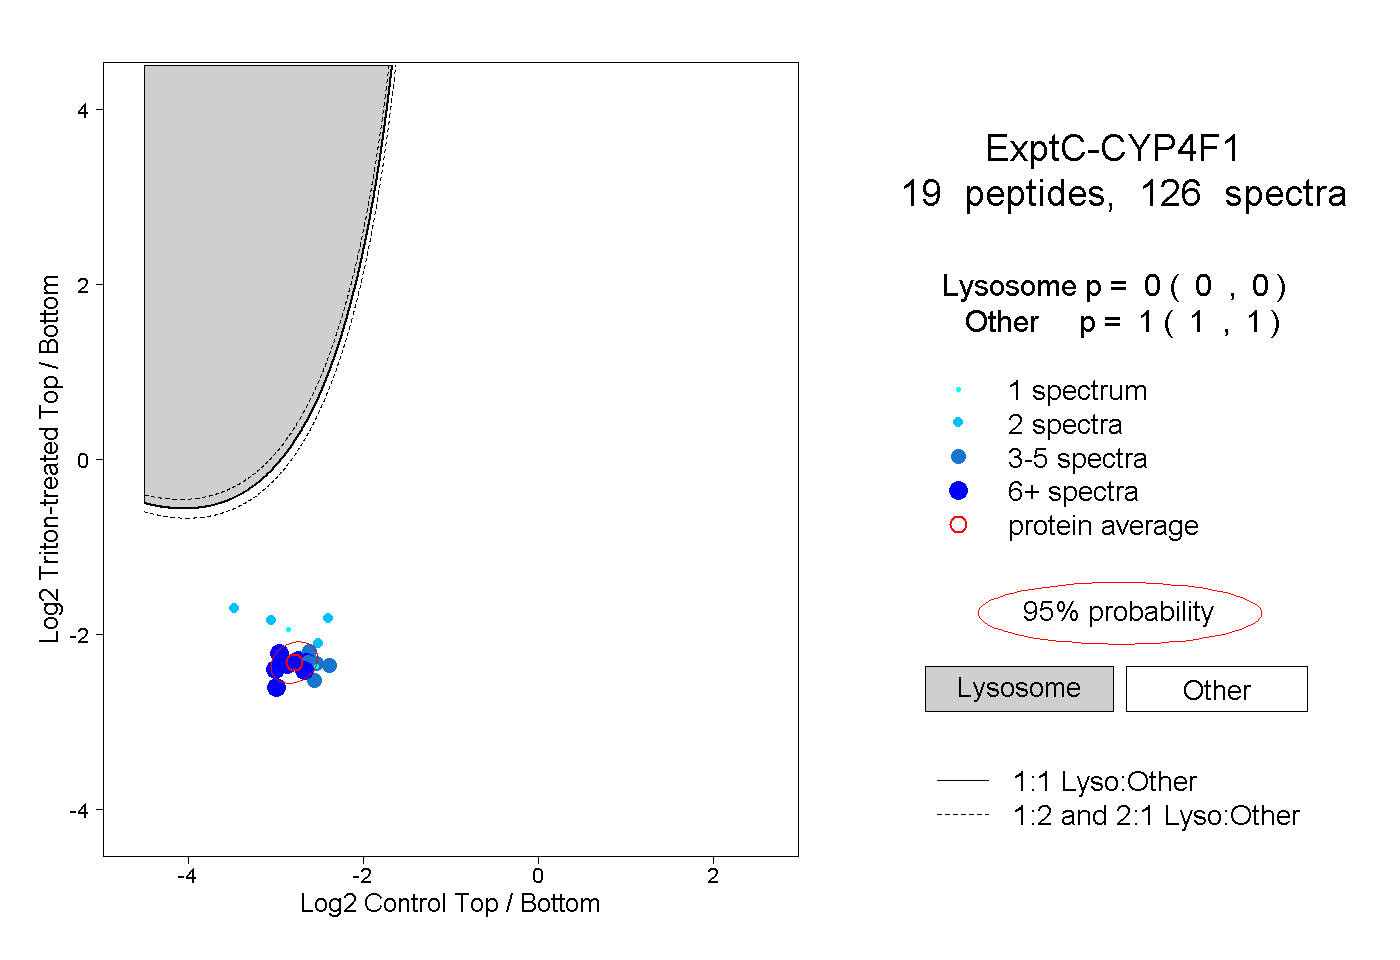
0.000 | 0.000
1.000 | 1.000