 1
1peptide
spectra
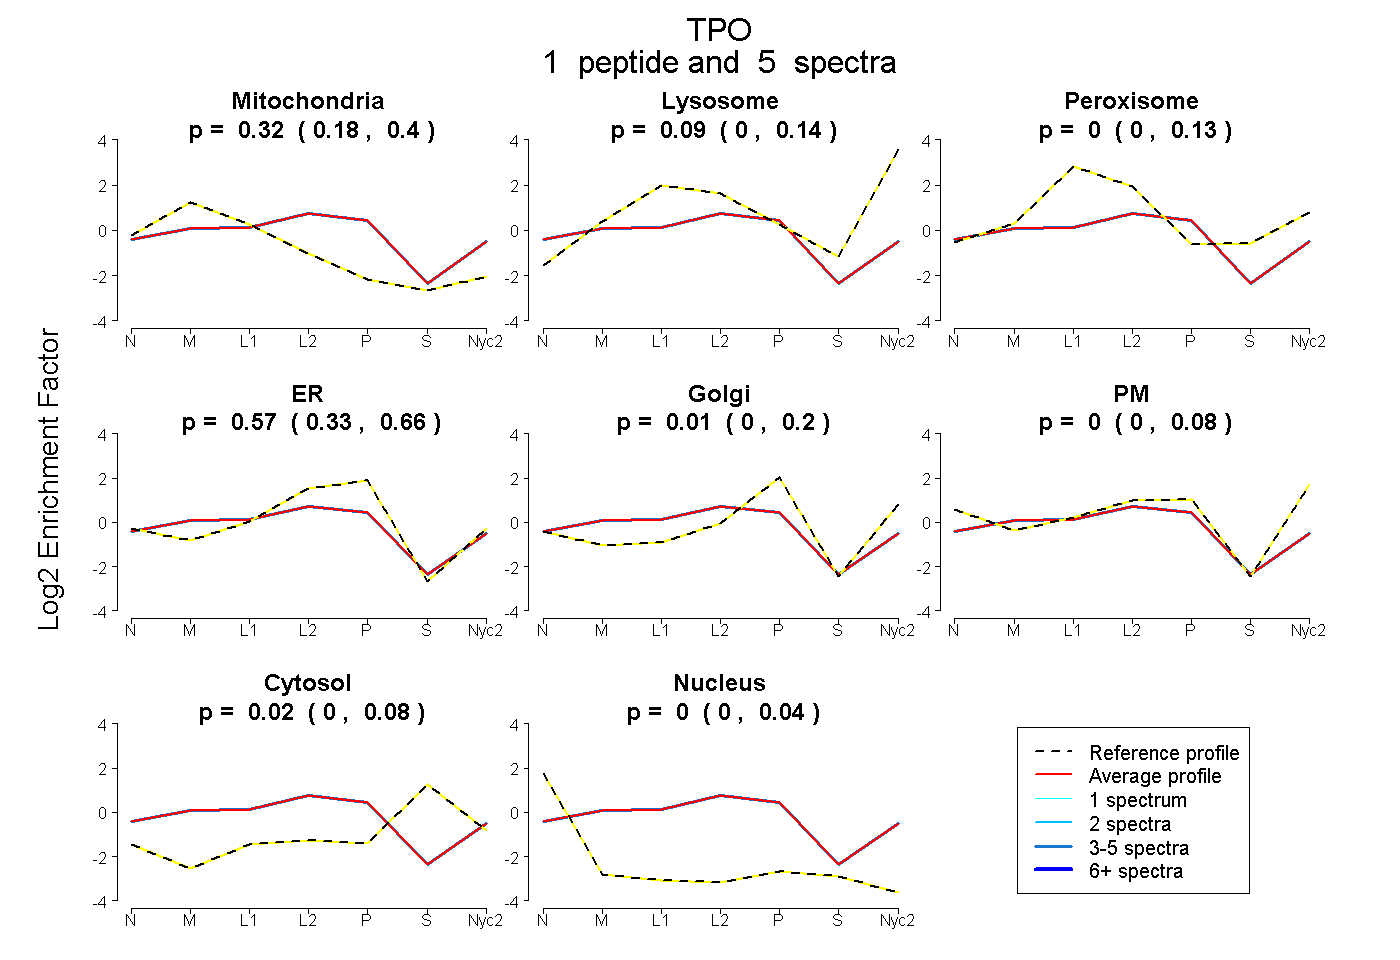
0.178 | 0.395
0.000 | 0.140
0.000 | 0.130
0.335 | 0.662
0.000 | 0.196
0.000 | 0.080
0.000 | 0.085
0.000 | 0.043
2peptides
spectra
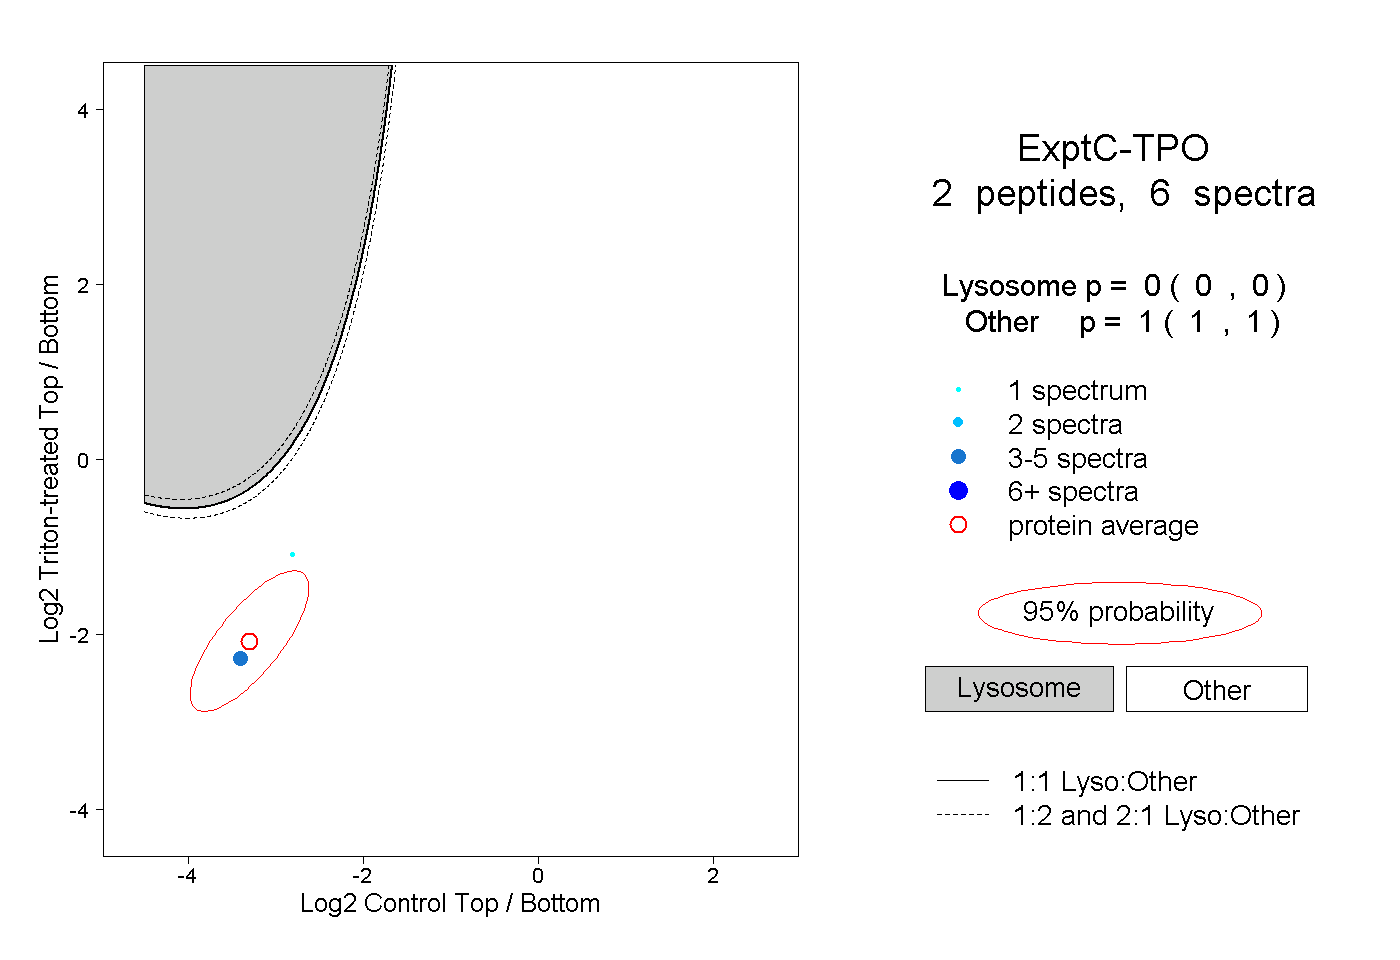
0.000 | 0.000
1.000 | 1.000
1peptide
spectrum
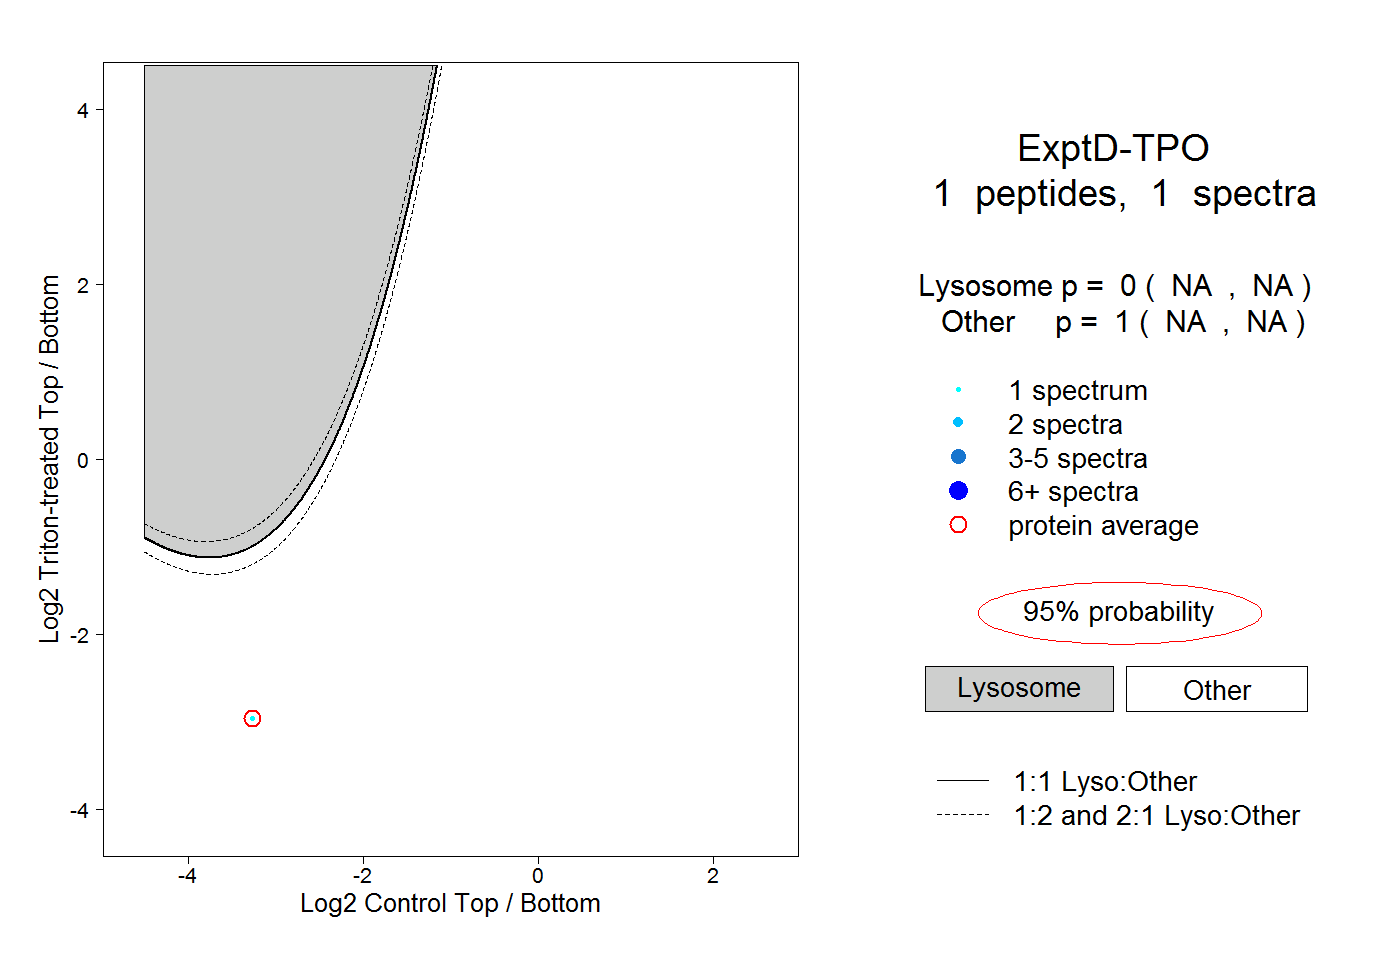
NA | NA
NA | NA