 4
4peptides
spectra
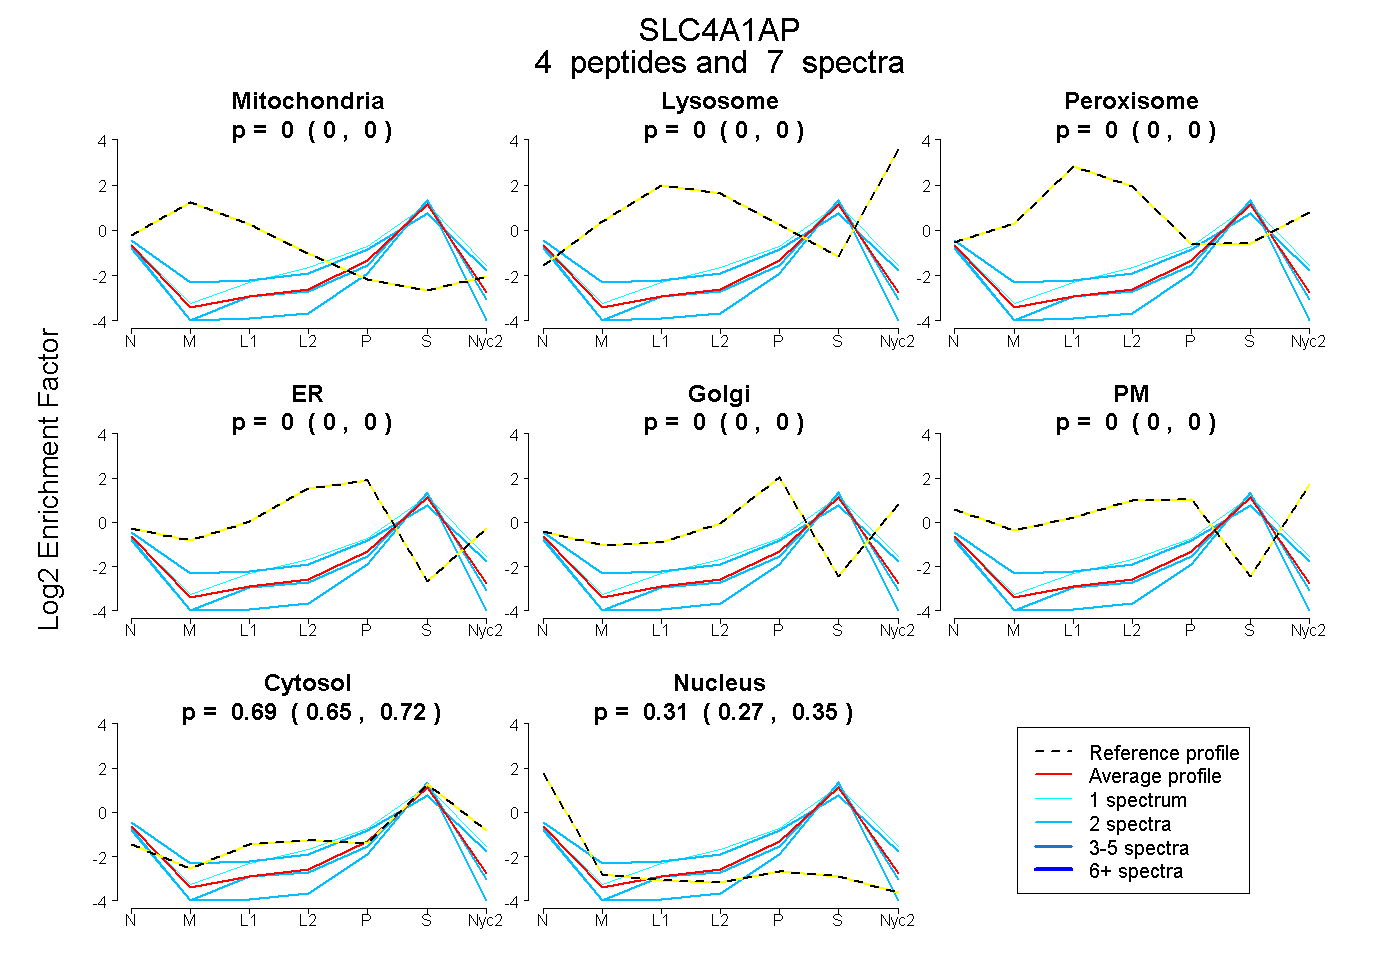
0.000 | 0.000
0.000 | 0.000
0.000 | 0.000
0.000 | 0.000
0.000 | 0.000
0.000 | 0.000
0.649 | 0.722
0.270 | 0.345
| Plot | Mito | Lyso | Perox | ER | Golgi | PM | Cytosol | Nucleus | |||||
| Expt A |
4 peptides |
7 spectra |
|
0.000 0.000 | 0.000 |
0.000 0.000 | 0.000 |
0.000 0.000 | 0.000 |
0.000 0.000 | 0.000 |
0.000 0.000 | 0.000 |
0.000 0.000 | 0.000 |
0.690 0.649 | 0.722 |
0.310 0.270 | 0.345 |
| 2 spectra, KPVLPVPPAVR | 0.000 | 0.000 | 0.000 | 0.000 | 0.000 | 0.000 | 0.675 | 0.325 | ||
| 2 spectra, VHVGHVIR | 0.000 | 0.000 | 0.000 | 0.000 | 0.033 | 0.000 | 0.752 | 0.215 | ||
| 2 spectra, VAPASGGPTR | 0.000 | 0.000 | 0.000 | 0.000 | 0.000 | 0.000 | 0.533 | 0.467 | ||
| 1 spectrum, LALPLFGAMK | 0.000 | 0.000 | 0.000 | 0.000 | 0.000 | 0.000 | 0.851 | 0.149 |
| Plot | Mito | Lyso or Perox | ER | Golgi | PM | Cytosol | Nucleus | ||||||
| Expt B |
2 peptides |
2 spectra |
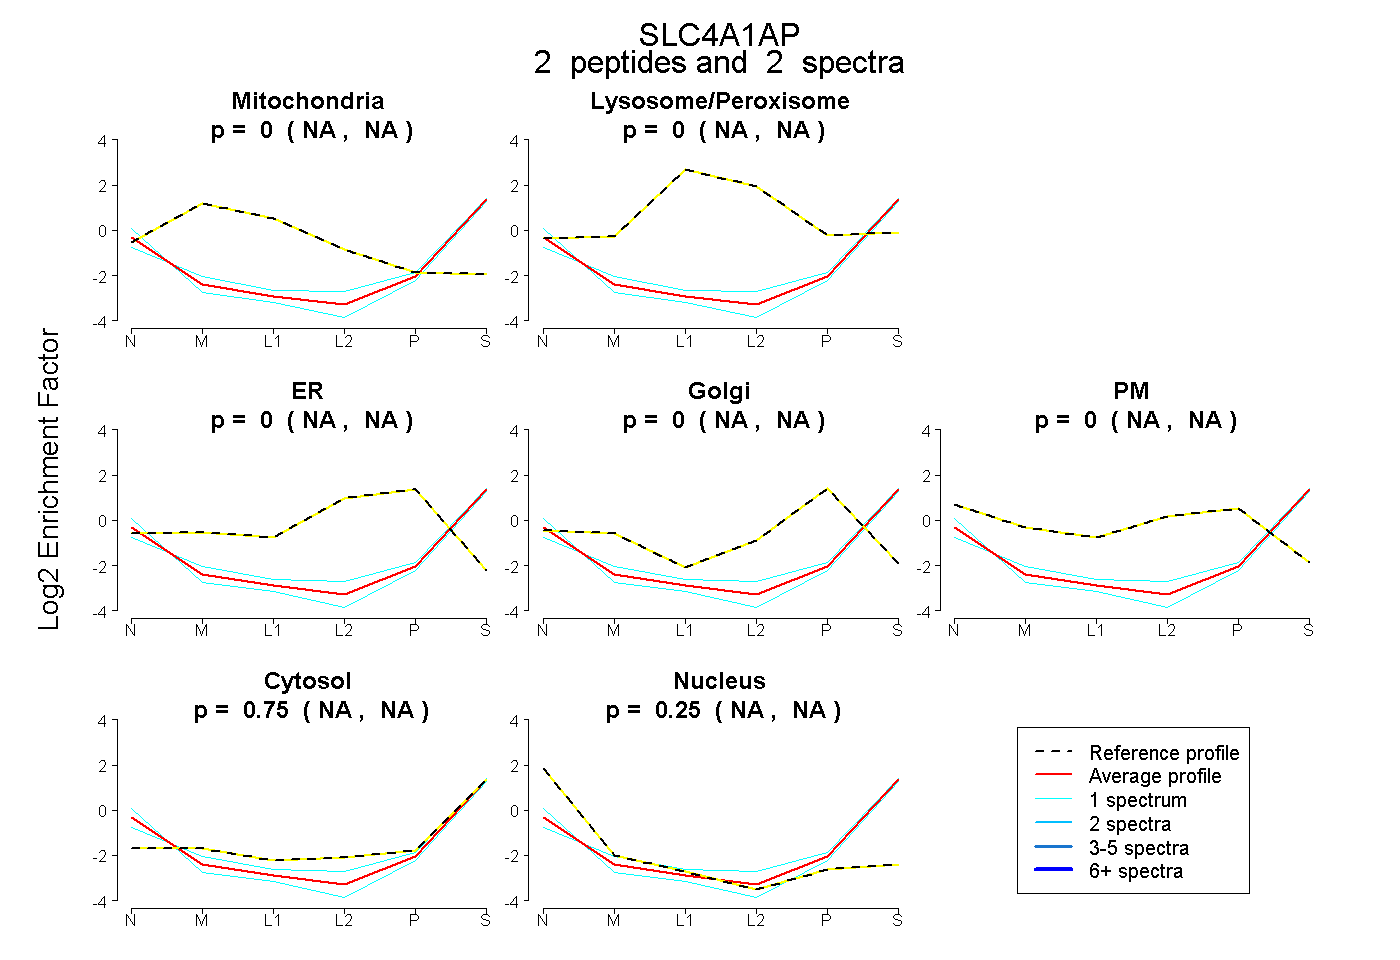 |
0.000 NA | NA |
0.000 NA | NA |
0.000 NA | NA |
0.000 NA | NA |
0.000 NA | NA |
0.750 NA | NA |
0.250 NA | NA |