 5
5peptides
spectra
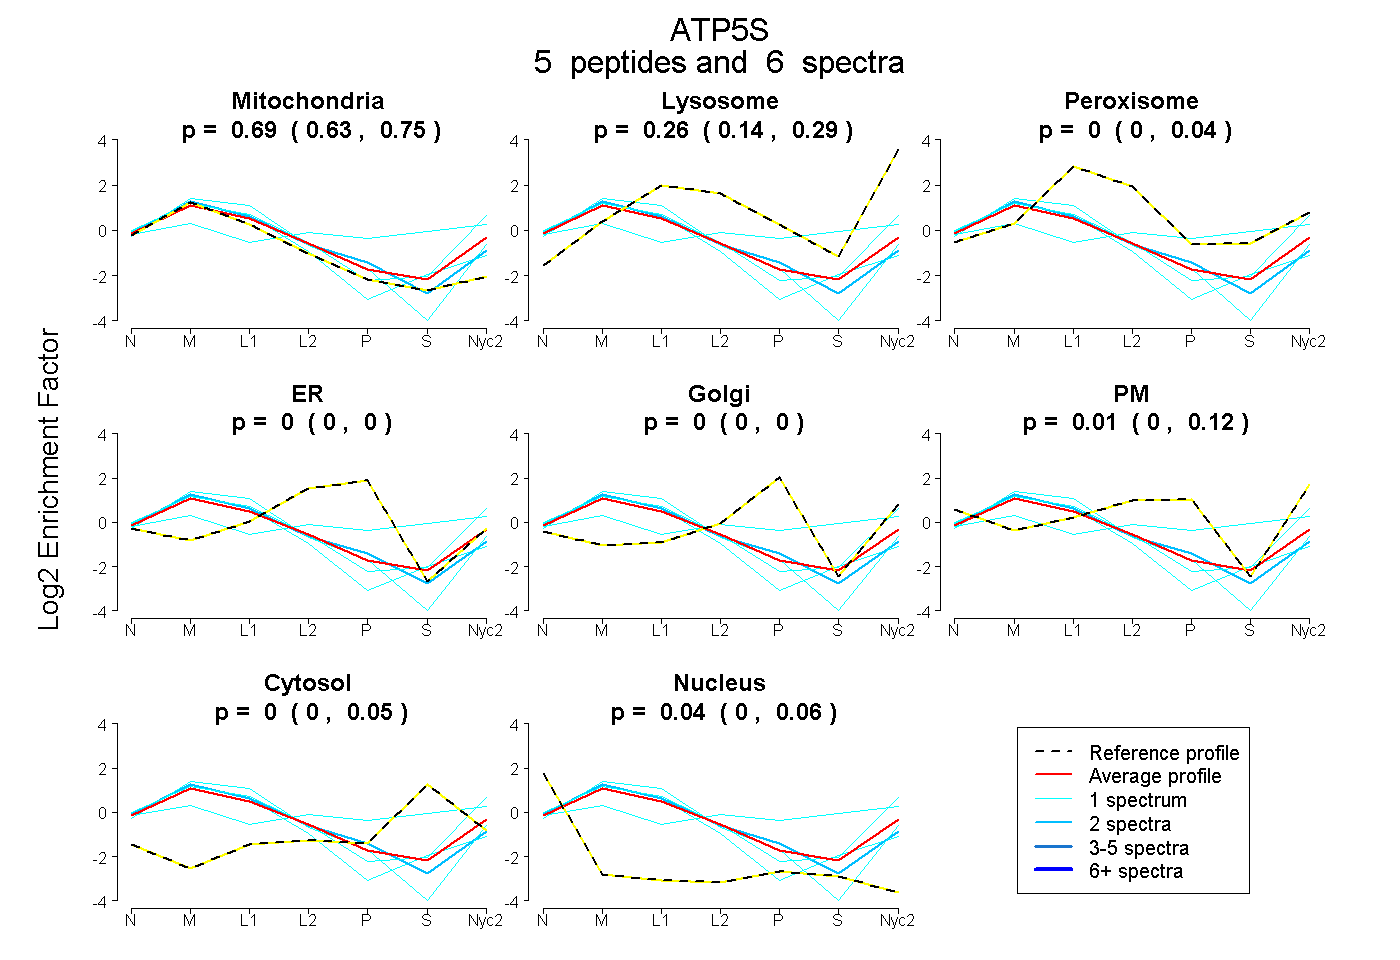
0.631 | 0.747
0.140 | 0.286
0.000 | 0.042
0.000 | 0.000
0.000 | 0.000
0.000 | 0.124
0.000 | 0.055
0.000 | 0.059
6peptides
spectra
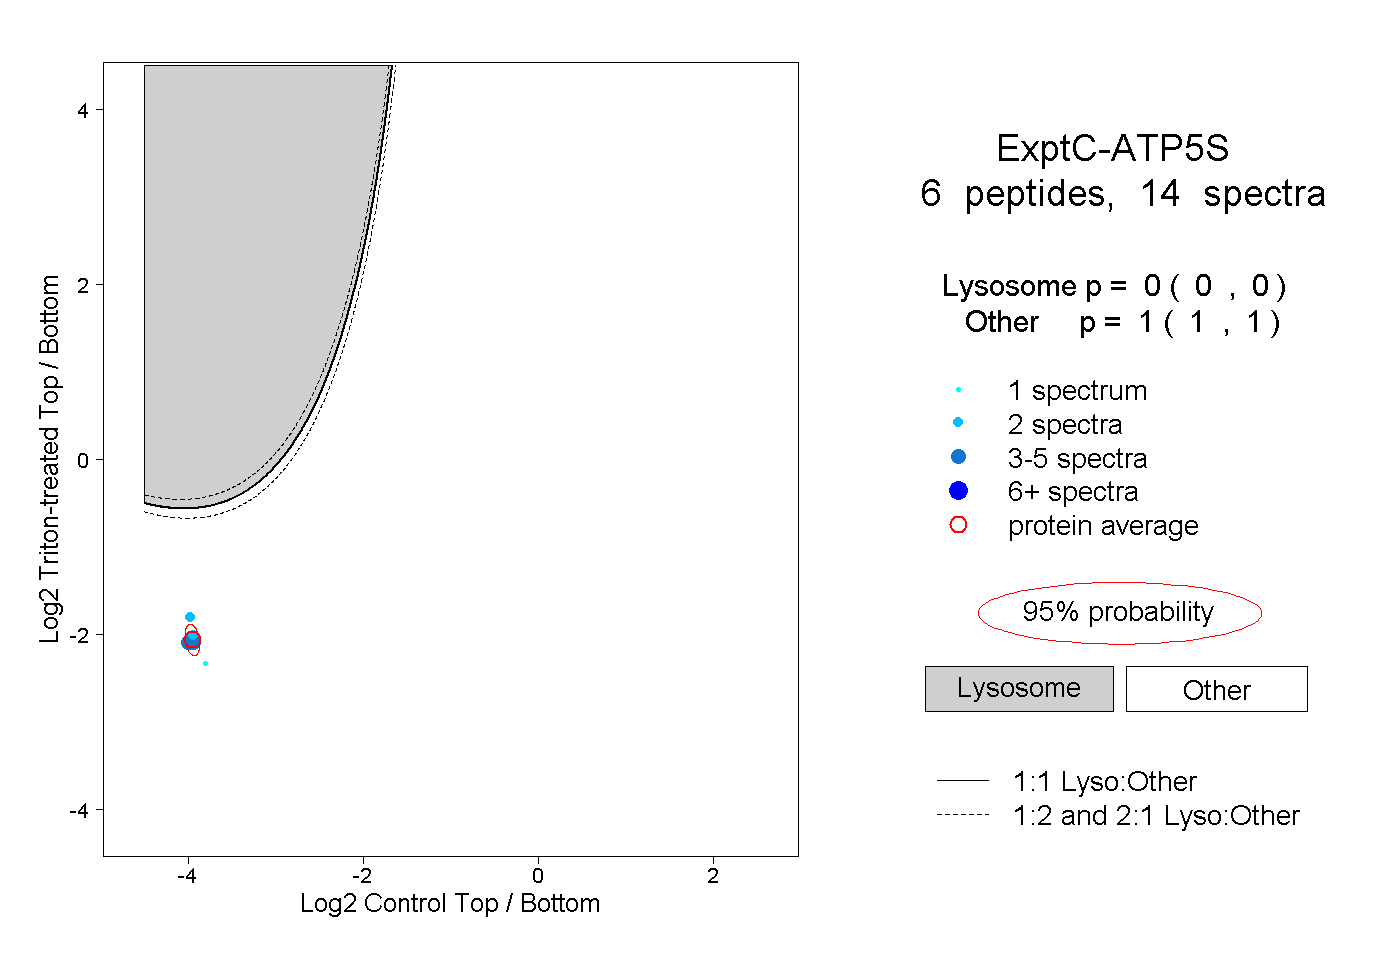
0.000 | 0.000
1.000 | 1.000
3peptides
spectra
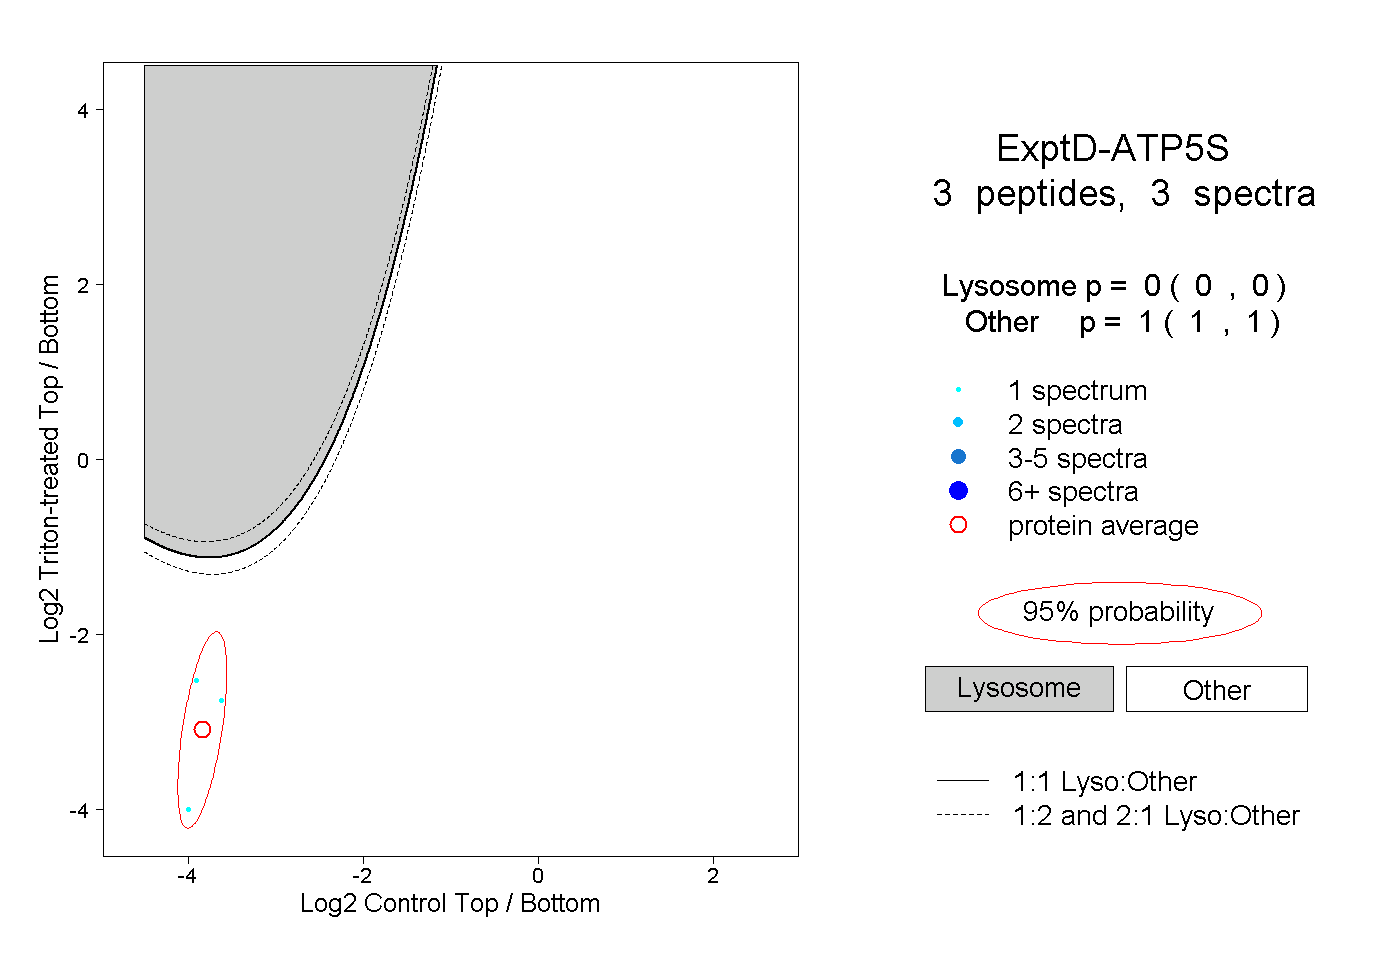
0.000 | 0.000
1.000 | 1.000