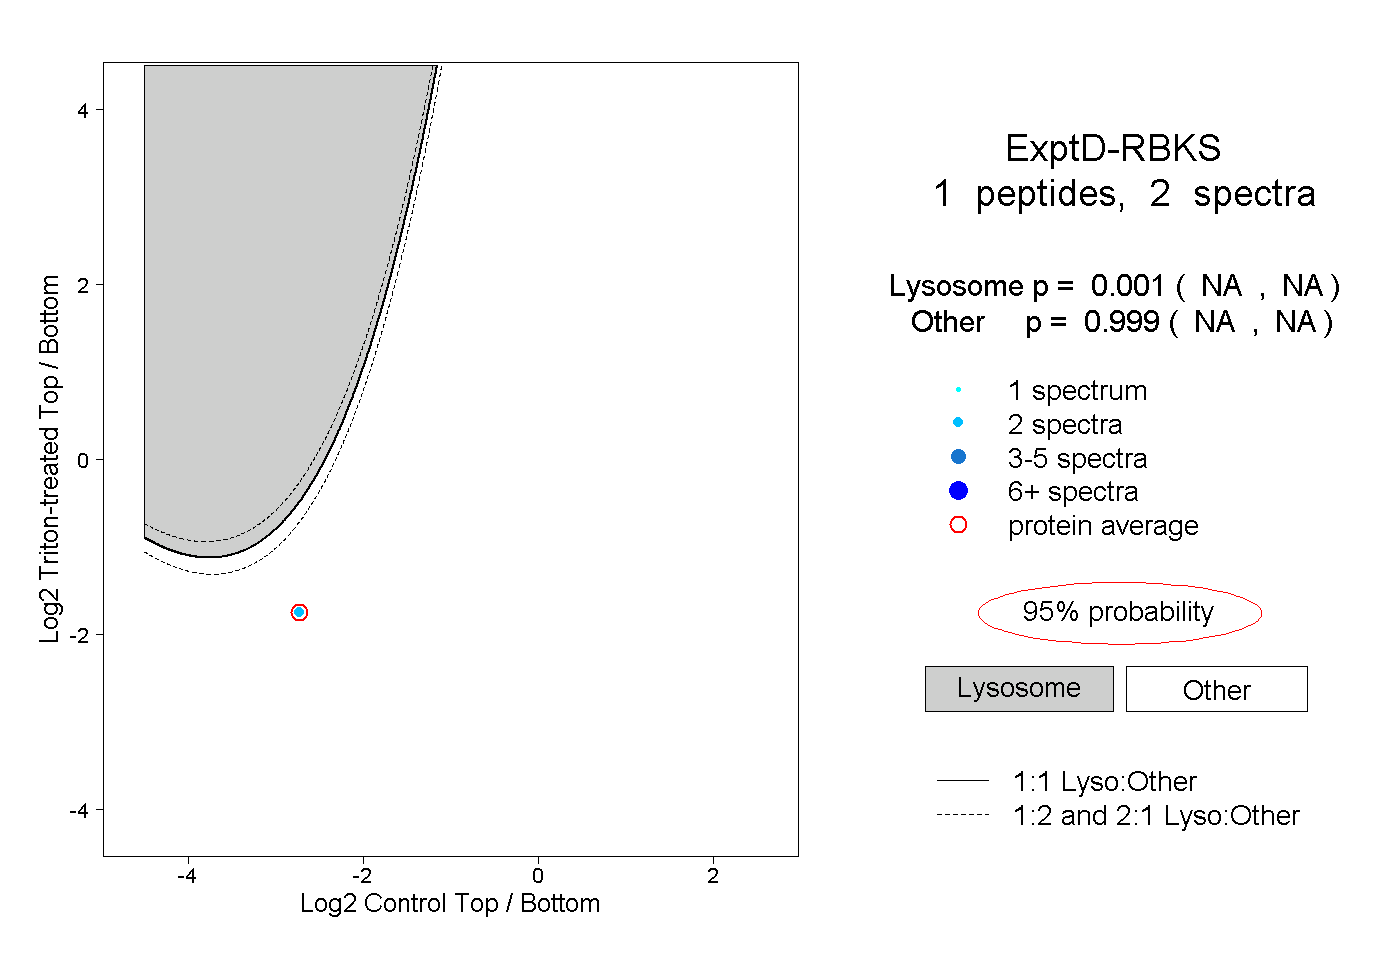
5
5peptides
spectra
0.000 | 0.000
0.000 | 0.000
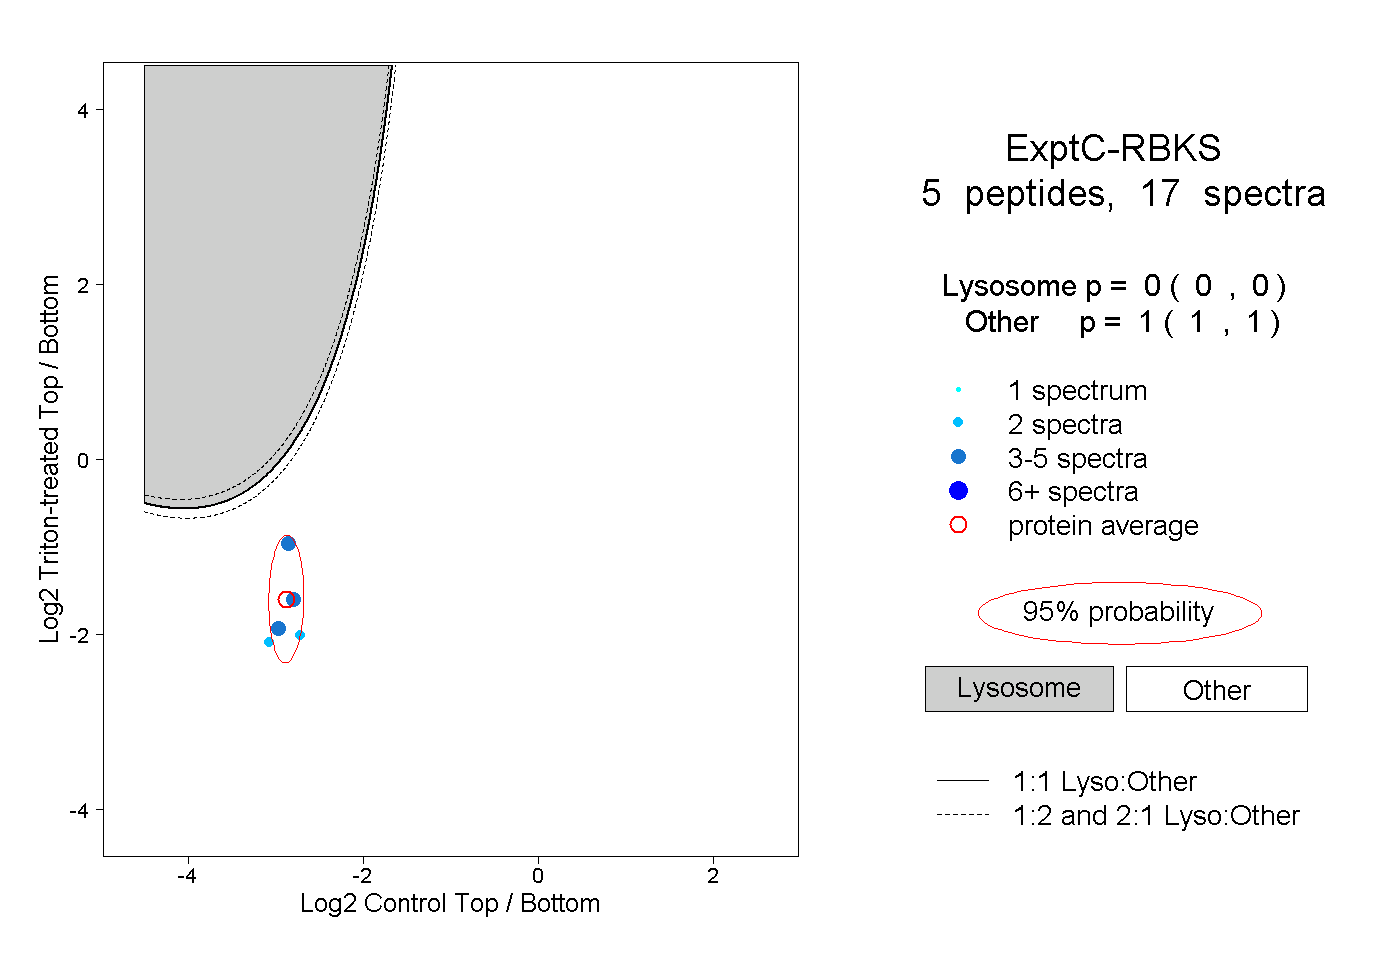
0.000 | 0.000
0.000 | 0.000
0.000 | 0.000
0.000 | 0.000
0.980 | 0.997
0.002 | 0.019
2peptides
spectra
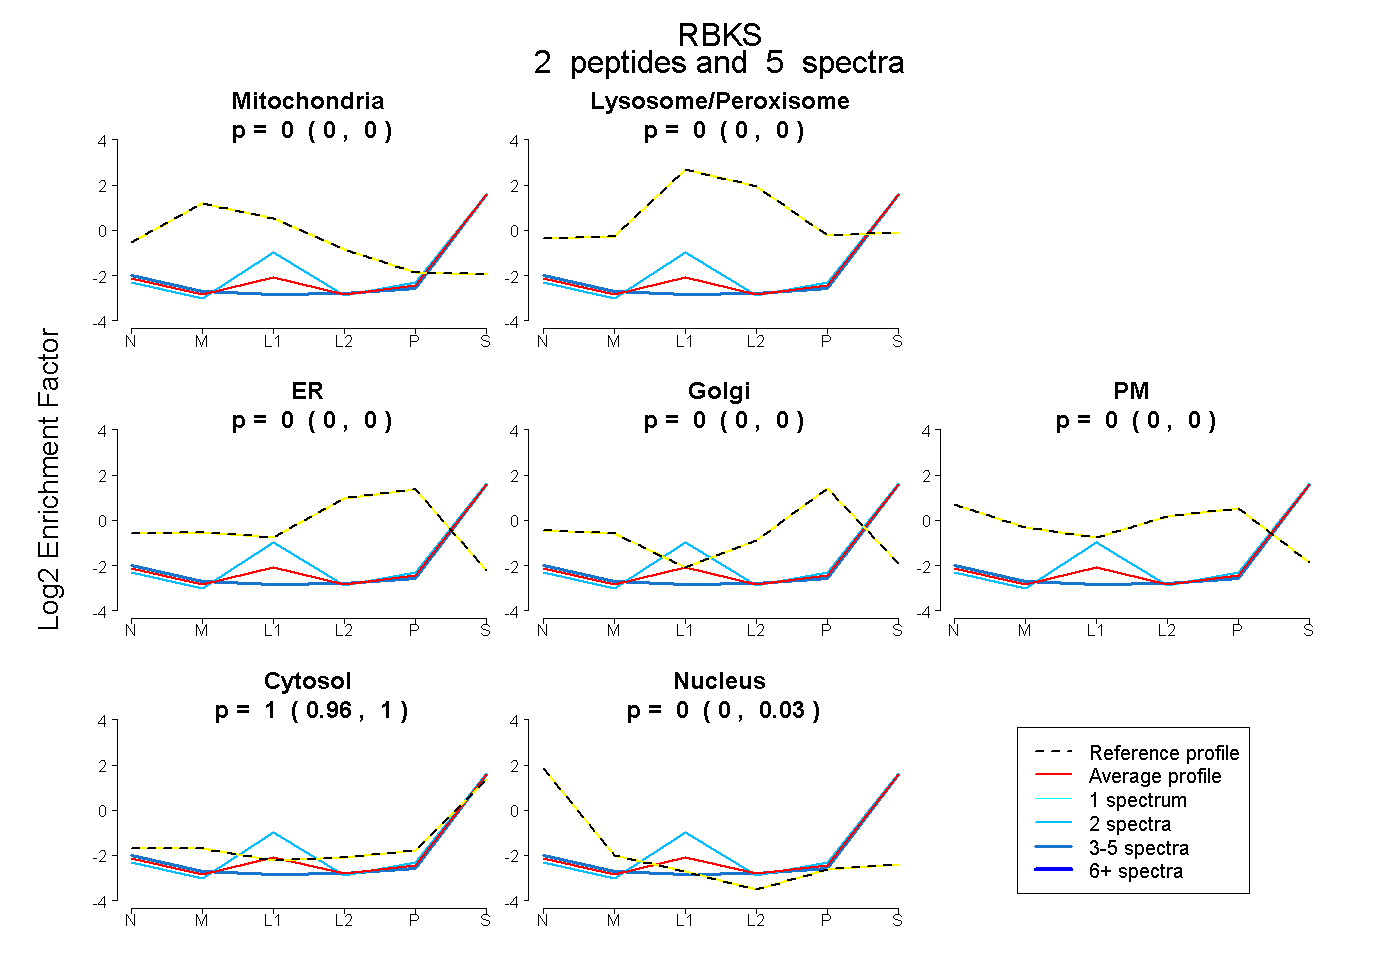
0.000 | 0.000
0.000 | 0.000
0.000 | 0.000
0.000 | 0.000
0.000 | 0.000
0.959 | 1.000
0.000 | 0.033
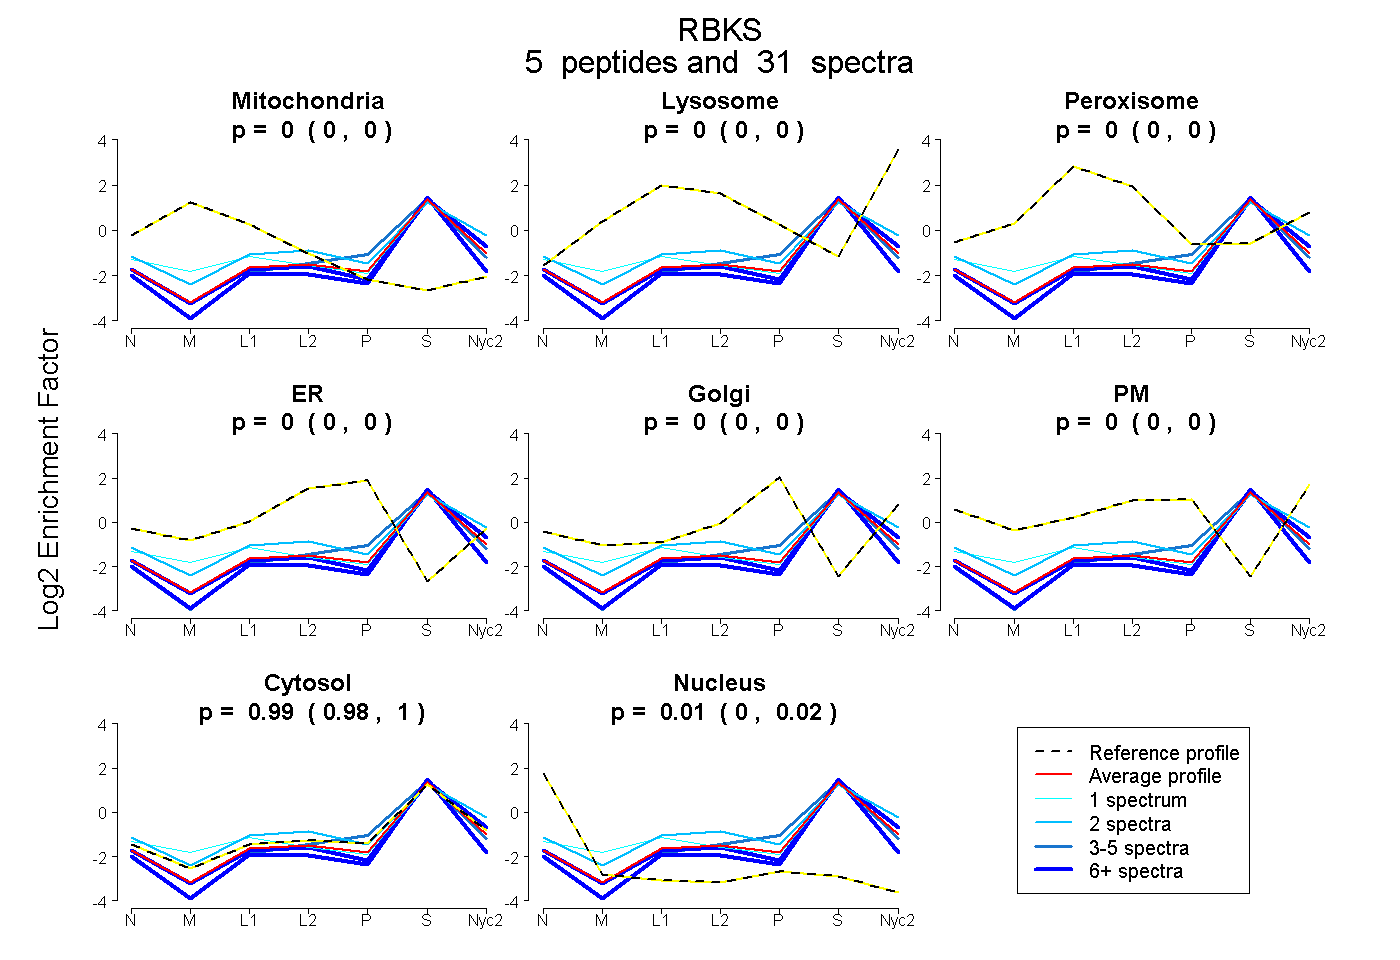
5peptides
spectra
0.000 | 0.000
1.000 | 1.000