 3
3peptides
spectra
0.000 | 0.000
0.000 | 0.000
0.000 | 0.000
0.000 | 0.071
0.343 | 0.528
0.207 | 0.352
0.053 | 0.203
0.072 | 0.149
4peptides
spectra
0.000 | 0.701
0.299 | 1.000
| Plot | Mito | Lyso | Perox | ER | Golgi | PM | Cytosol | Nucleus | |||||
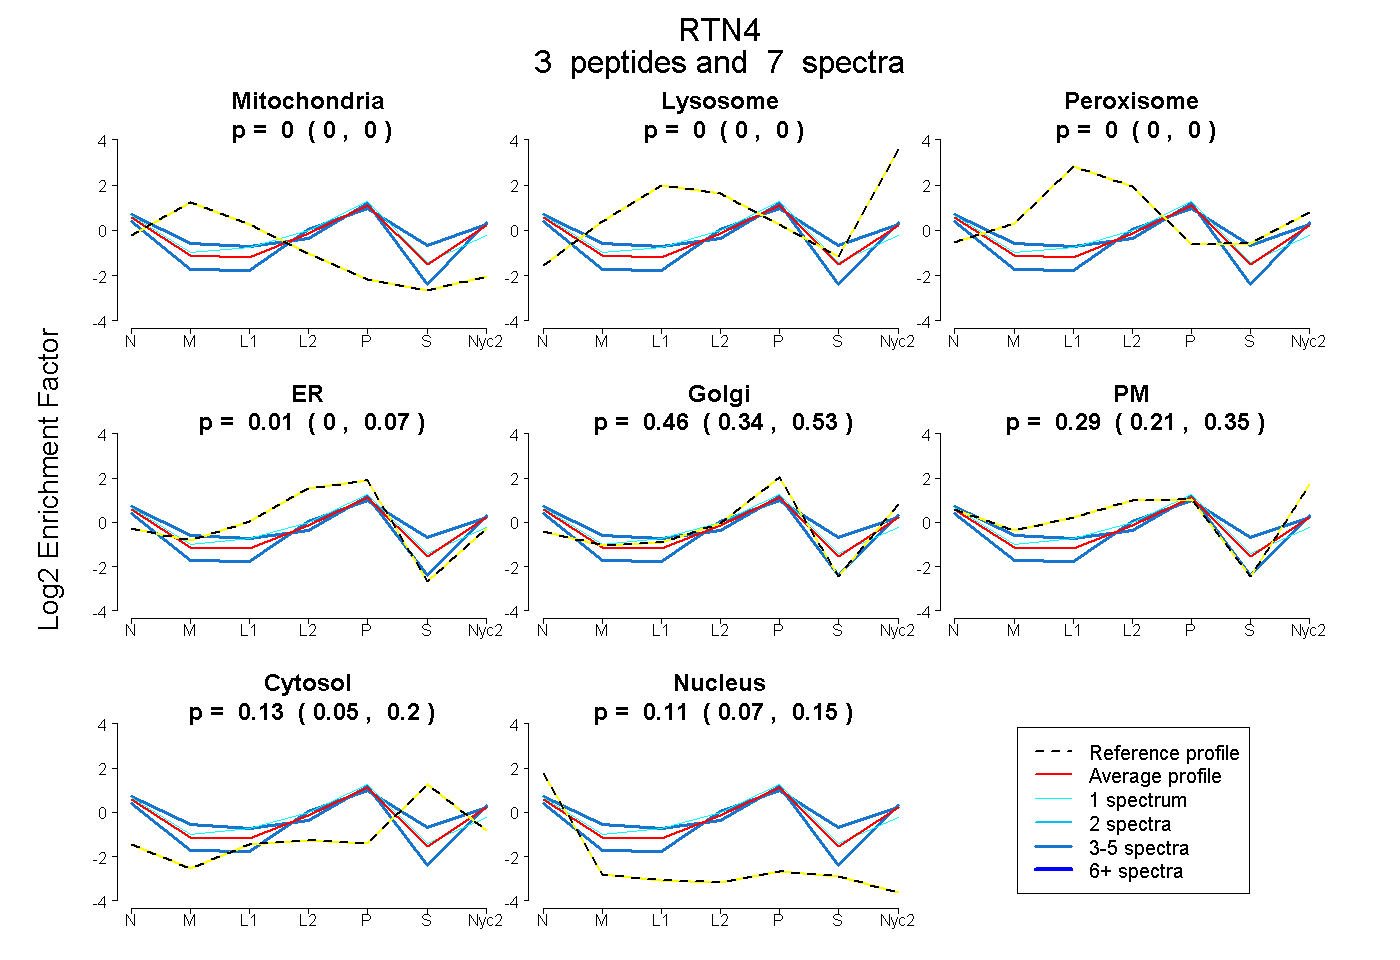
| Expt A |
3 peptides |
7 spectra |
|
0.000 0.000 | 0.000 |
0.000 0.000 | 0.000 |
0.000 0.000 | 0.000 |
0.007 0.000 | 0.071 |
0.455 0.343 | 0.528 |
0.290 0.207 | 0.352 |
0.133 0.053 | 0.203 |
0.114 0.072 | 0.149 |
||
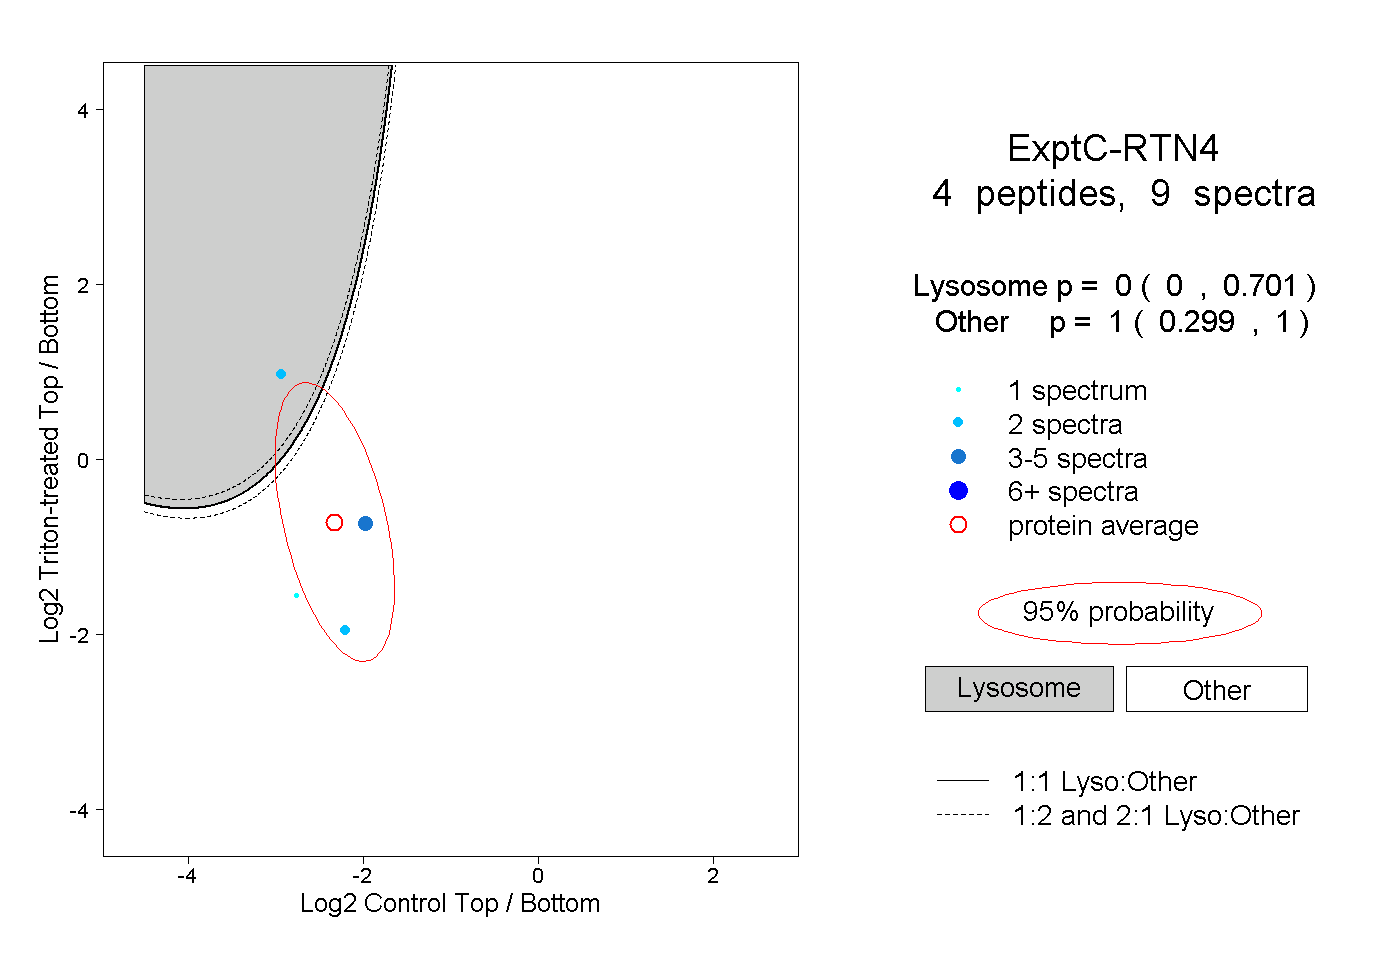
| Plot | Lyso | Other | |||||||||||
| Expt C |
4 peptides |
9 spectra |
|
0.000 0.000 | 0.701 |
1.000 0.299 | 1.000 |