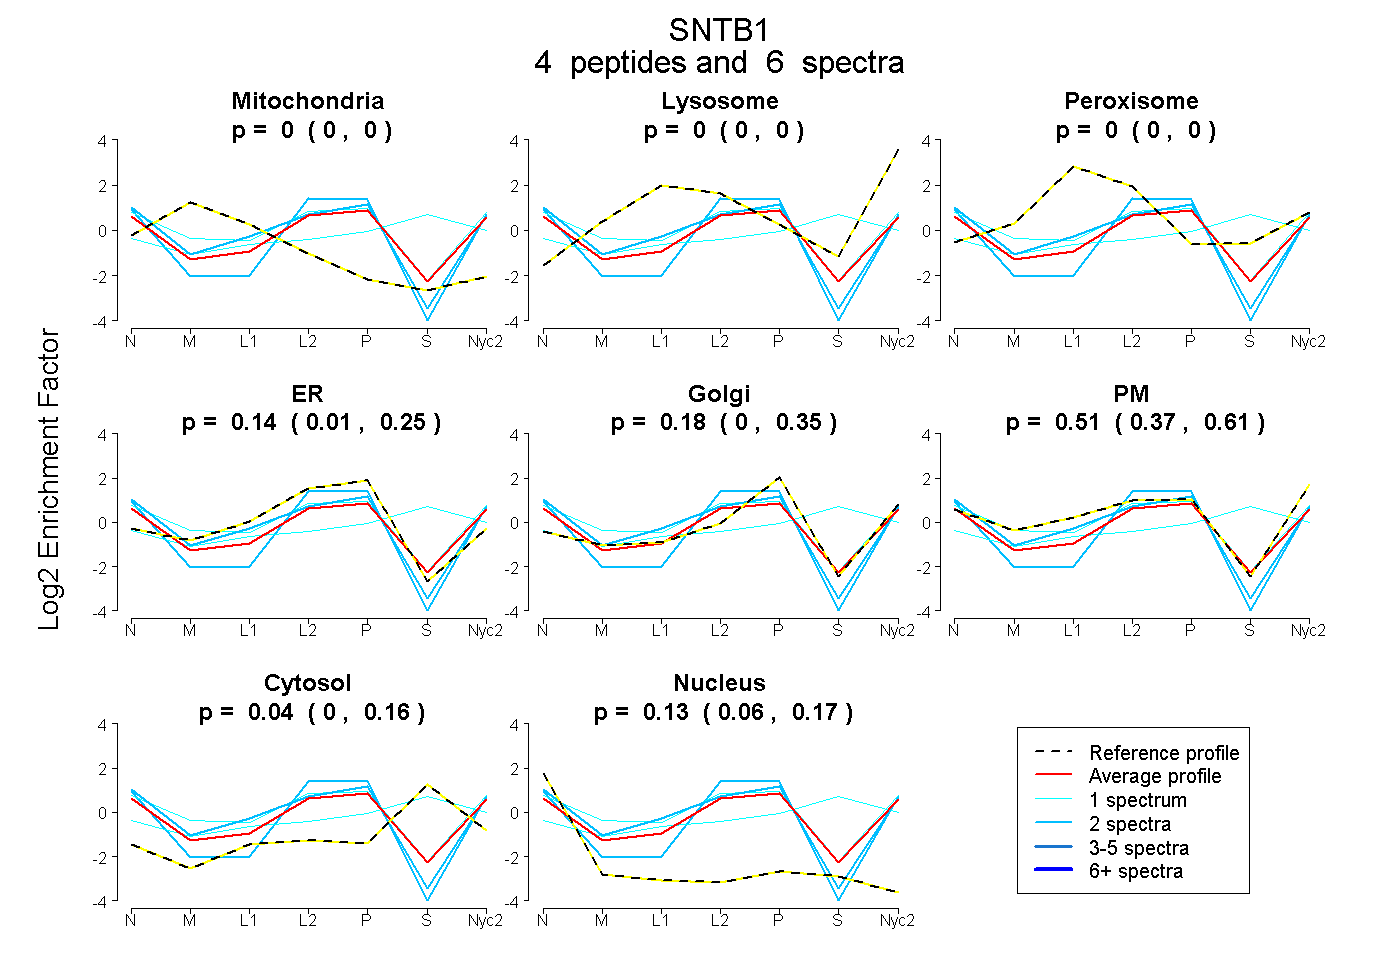
 4
4peptides
spectra
0.000 | 0.000
0.000 | 0.000
0.000 | 0.000
0.010 | 0.252
0.000 | 0.347
0.368 | 0.613
0.000 | 0.161
0.055 | 0.166
| Plot | Mito | Lyso | Perox | ER | Golgi | PM | Cytosol | Nucleus | |||||
| Expt A |
4 peptides |
6 spectra |
|
0.000 0.000 | 0.000 |
0.000 0.000 | 0.000 |
0.000 0.000 | 0.000 |
0.144 0.010 | 0.252 |
0.183 0.000 | 0.347 |
0.507 0.368 | 0.613 |
0.039 0.000 | 0.161 |
0.128 0.055 | 0.166 |
| 2 spectra, SGLLEVLVR | 0.000 | 0.000 | 0.000 | 0.254 | 0.000 | 0.630 | 0.000 | 0.116 | ||
| 2 spectra, DLSHWTR | 0.000 | 0.000 | 0.000 | 0.303 | 0.303 | 0.265 | 0.000 | 0.129 | ||
| 1 spectrum, HTVVLR | 0.000 | 0.000 | 0.000 | 0.167 | 0.000 | 0.735 | 0.008 | 0.090 | ||
| 1 spectrum, EATPYVK | 0.000 | 0.000 | 0.125 | 0.000 | 0.054 | 0.225 | 0.595 | 0.000 |
| Plot | Lyso | Other | |||||||||||
| Expt C |
5 peptides |
12 spectra |
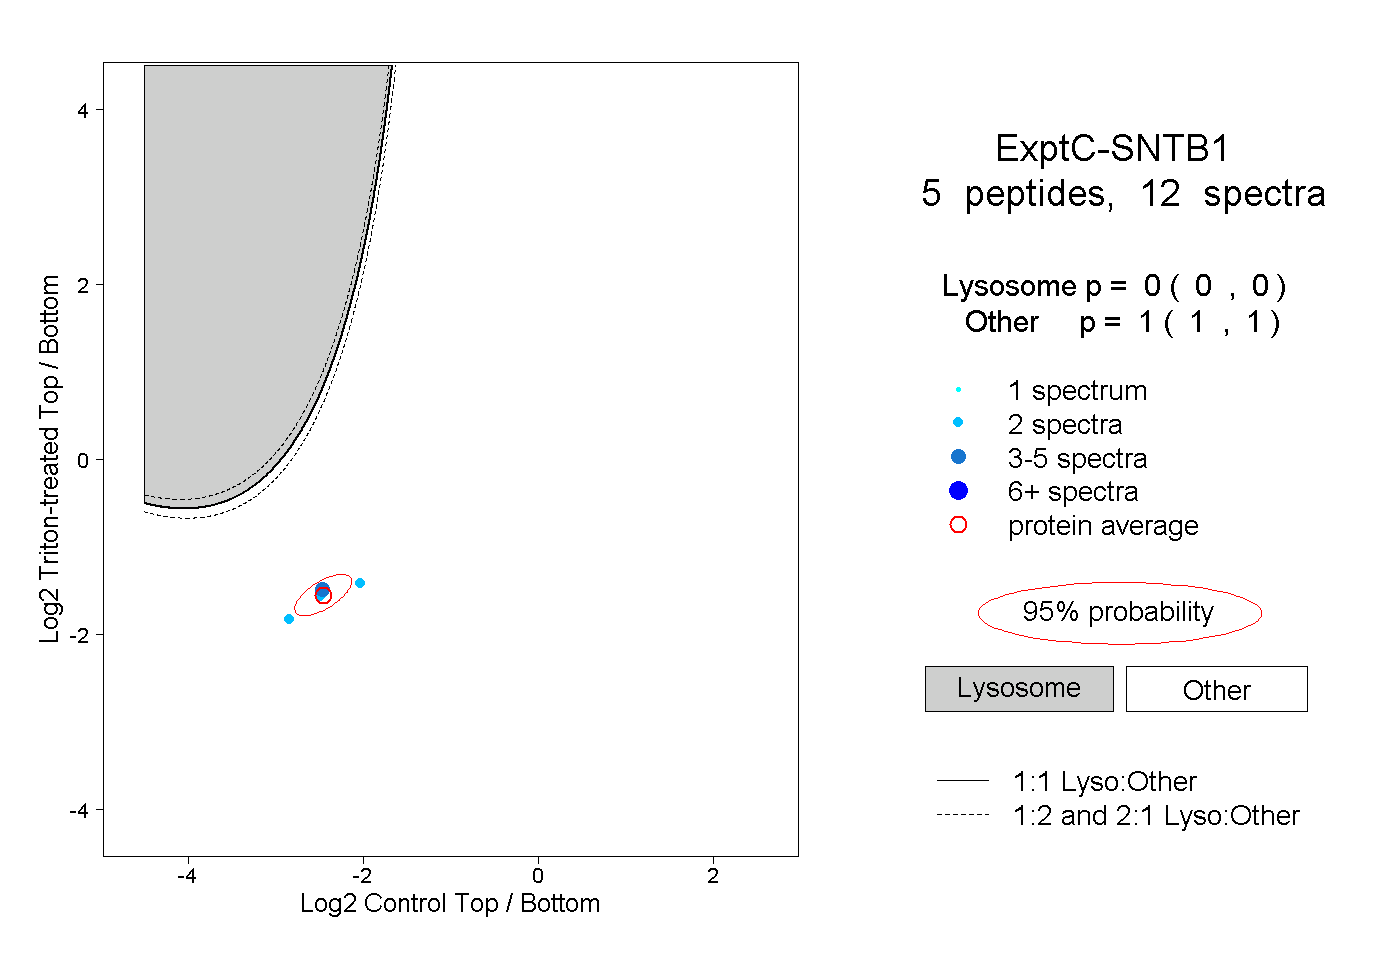 |
0.000 0.000 | 0.000 |
1.000 1.000 | 1.000 |