 8
8peptides
spectra
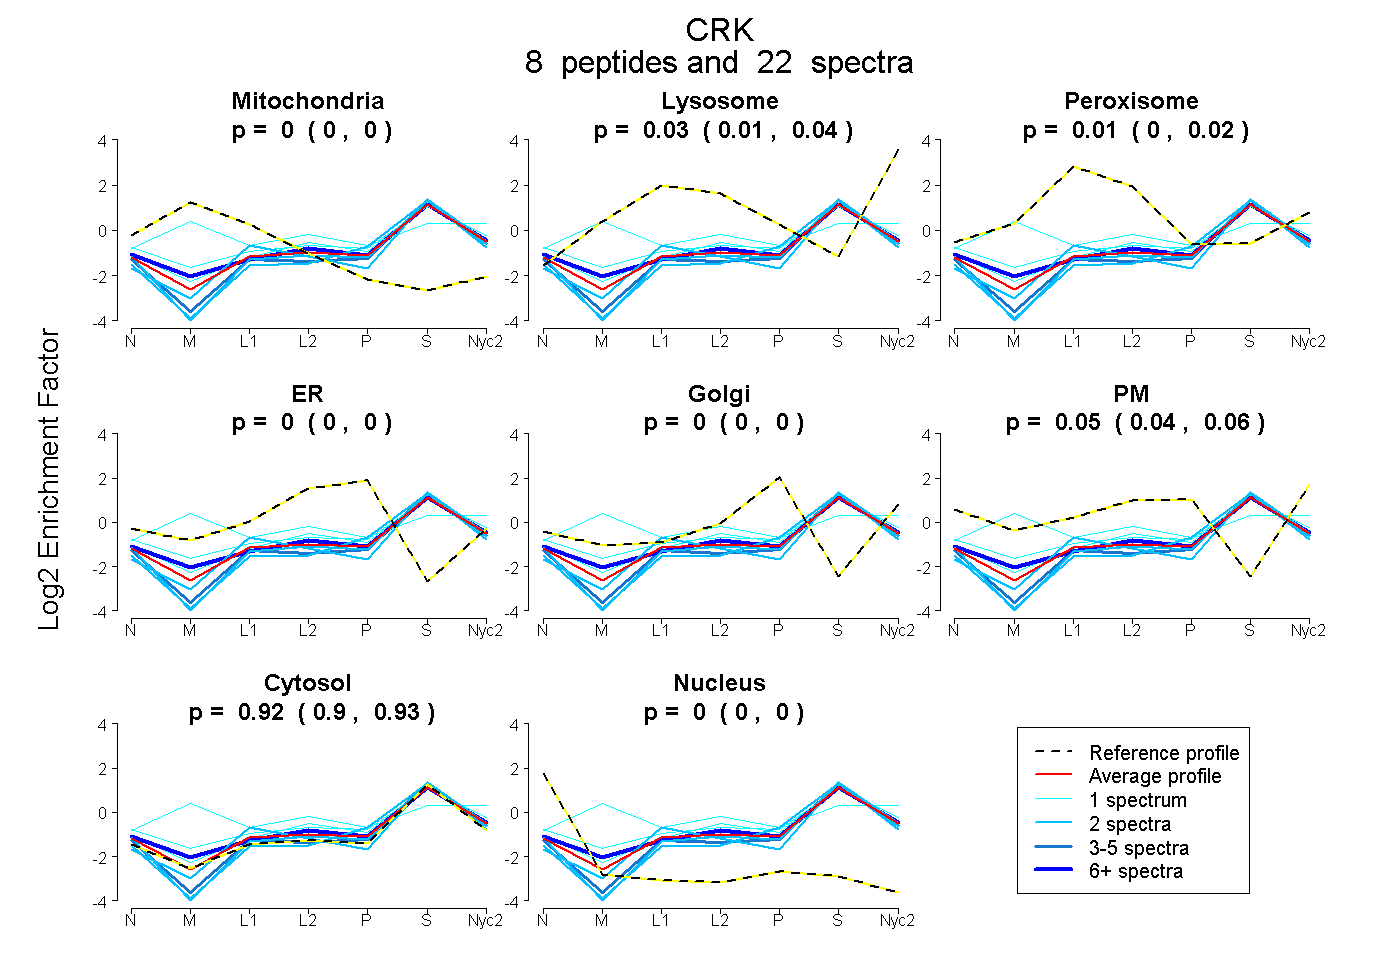
0.000 | 0.000
0.013 | 0.036
0.000 | 0.021
0.000 | 0.000
0.000 | 0.000
0.037 | 0.059
0.904 | 0.929
0.000 | 0.000
5peptides
spectra
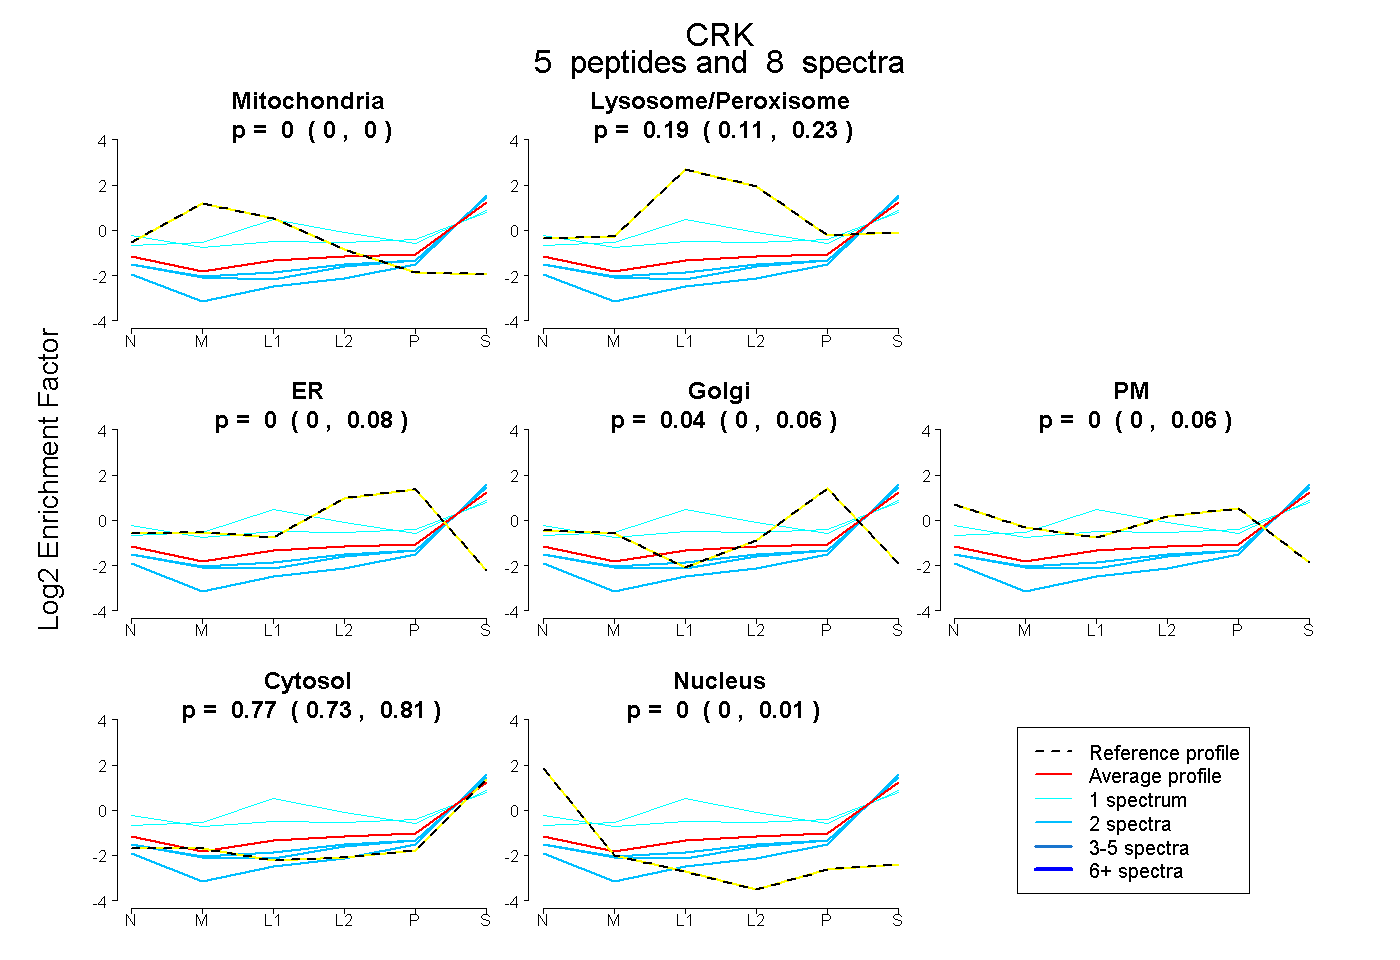
0.000 | 0.000
0.107 | 0.234
0.000 | 0.080
0.000 | 0.058
0.000 | 0.056
0.734 | 0.807
0.000 | 0.008
6peptides
spectra
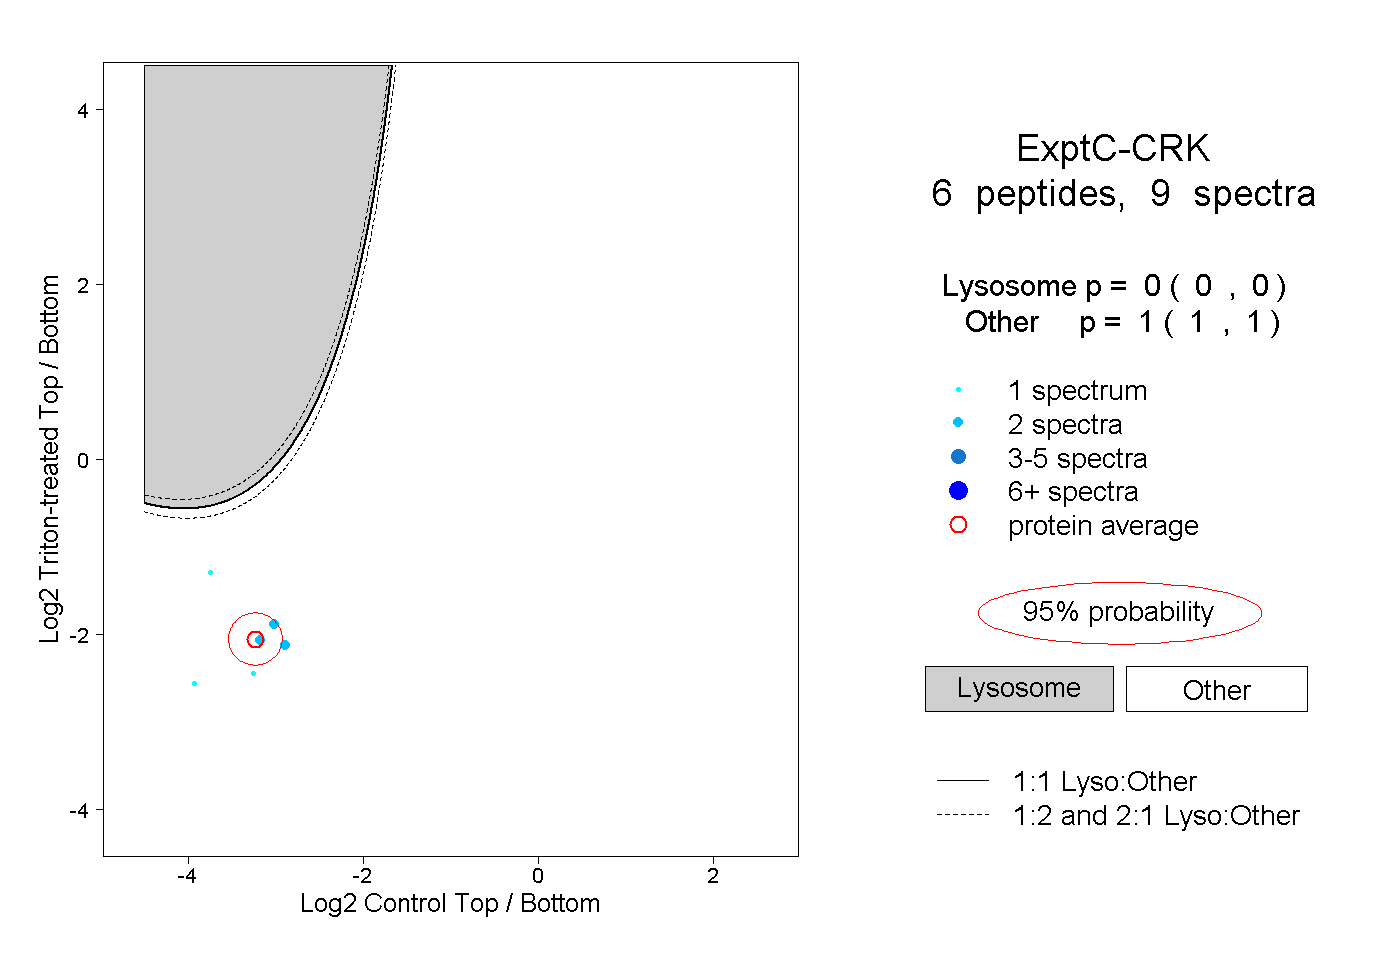
0.000 | 0.000
1.000 | 1.000
1peptide
spectrum
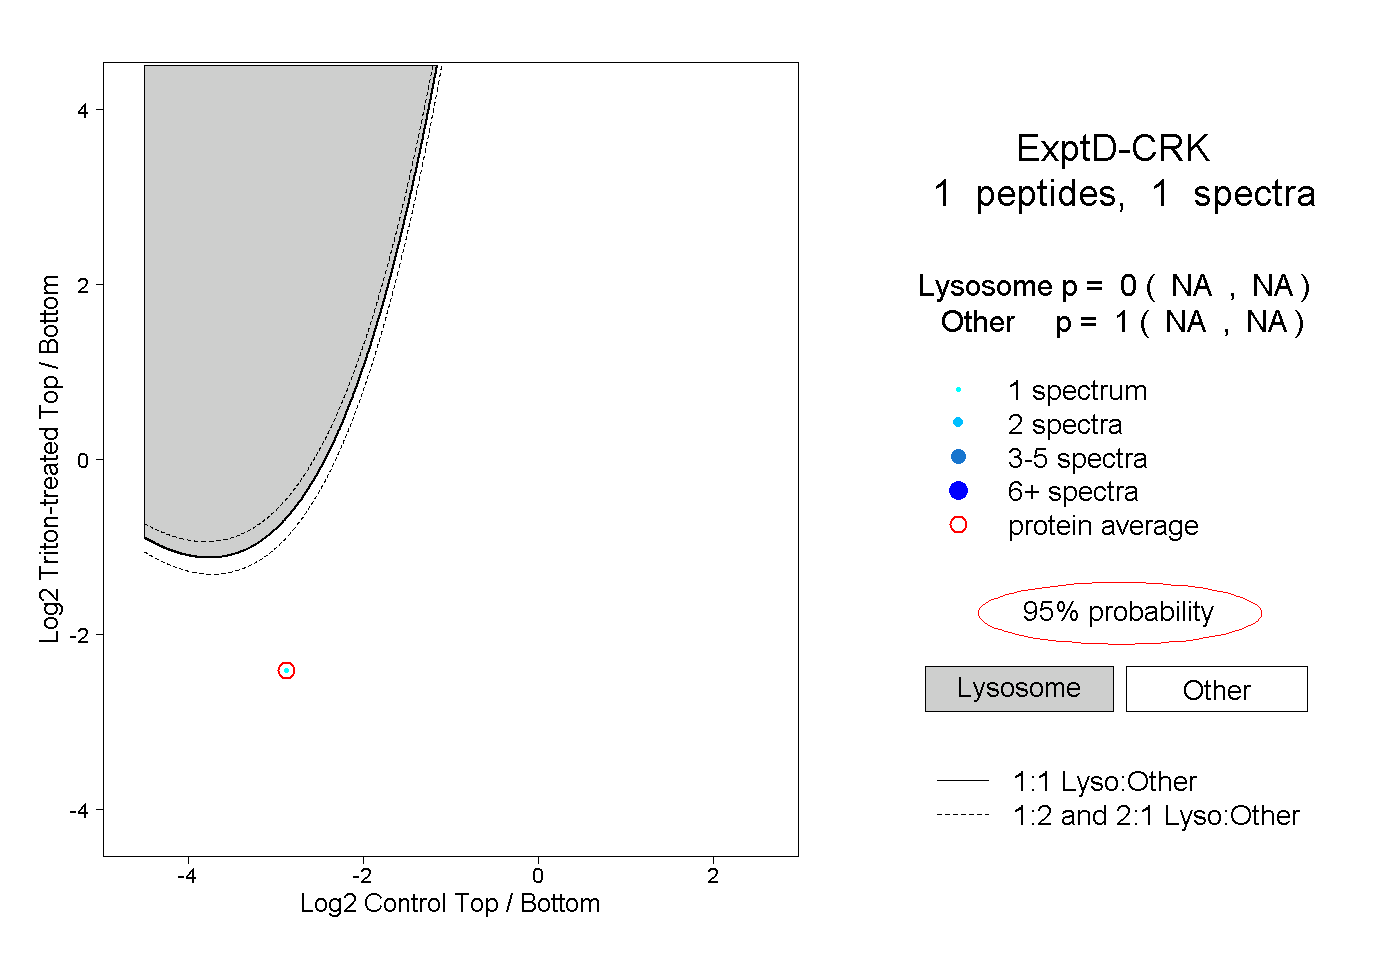
NA | NA
NA | NA