 18
18peptides
spectra
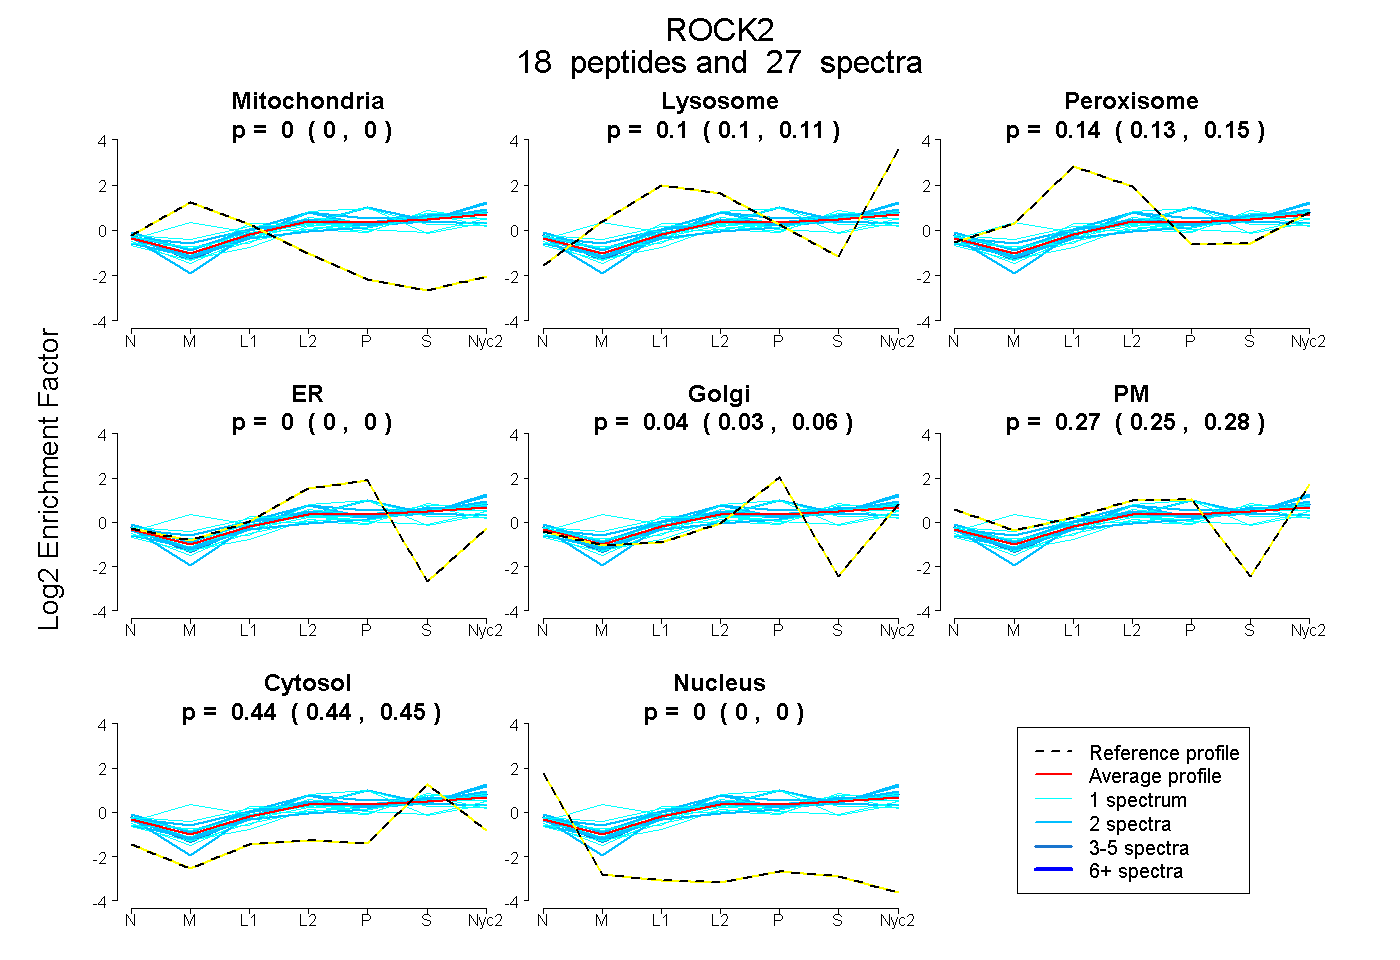
0.000 | 0.000
0.097 | 0.112
0.129 | 0.150
0.000 | 0.000
0.027 | 0.058
0.249 | 0.280
0.438 | 0.450
0.000 | 0.000
7peptides
spectra
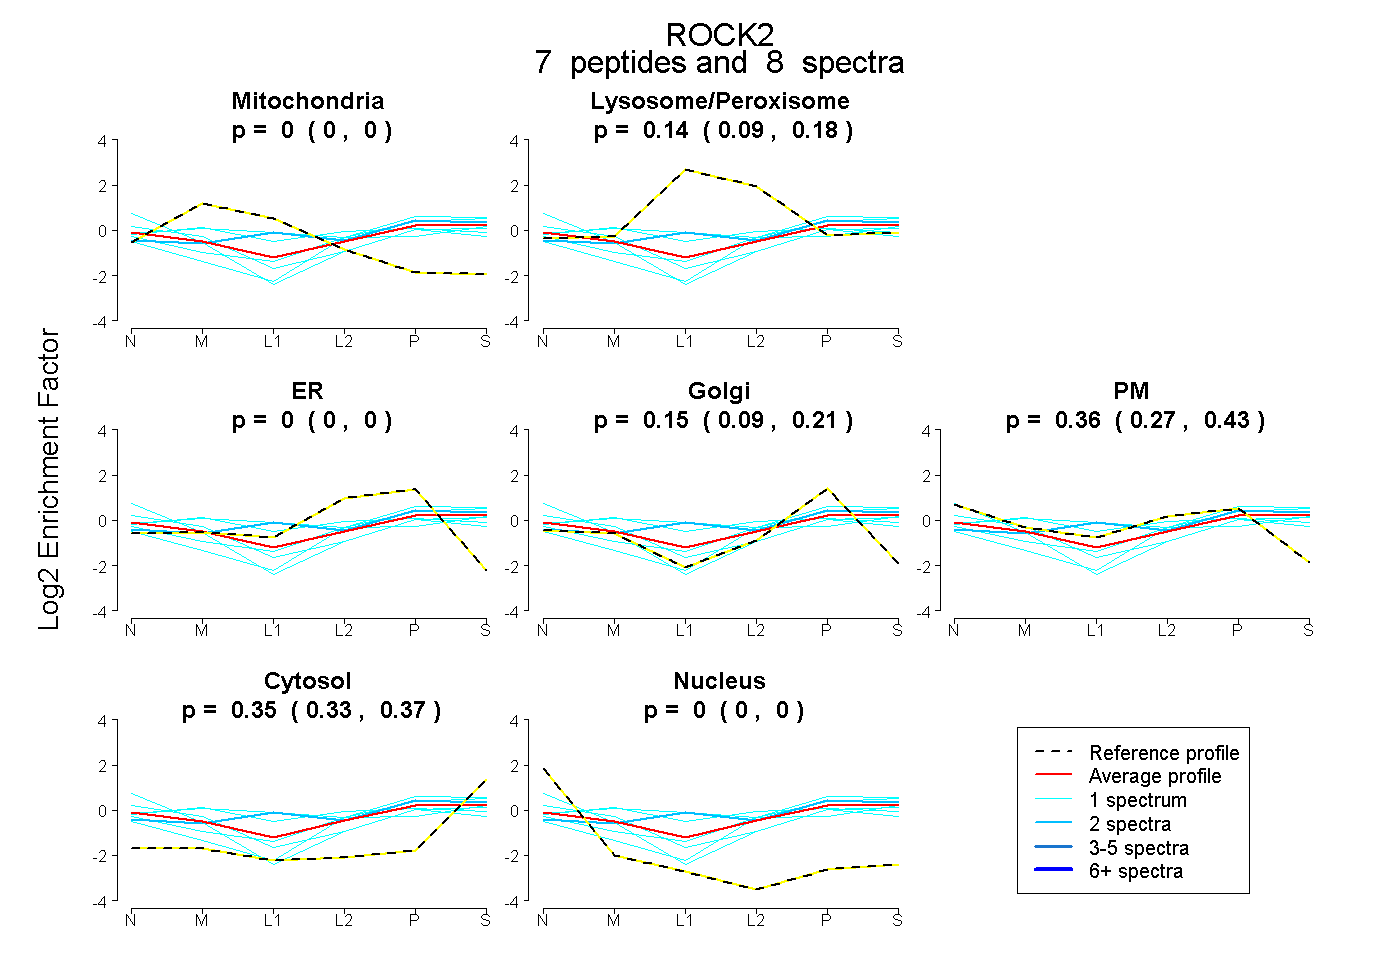
0.000 | 0.000
0.092 | 0.182
0.000 | 0.000
0.093 | 0.206
0.269 | 0.428
0.328 | 0.367
0.000 | 0.000
21peptides
spectra
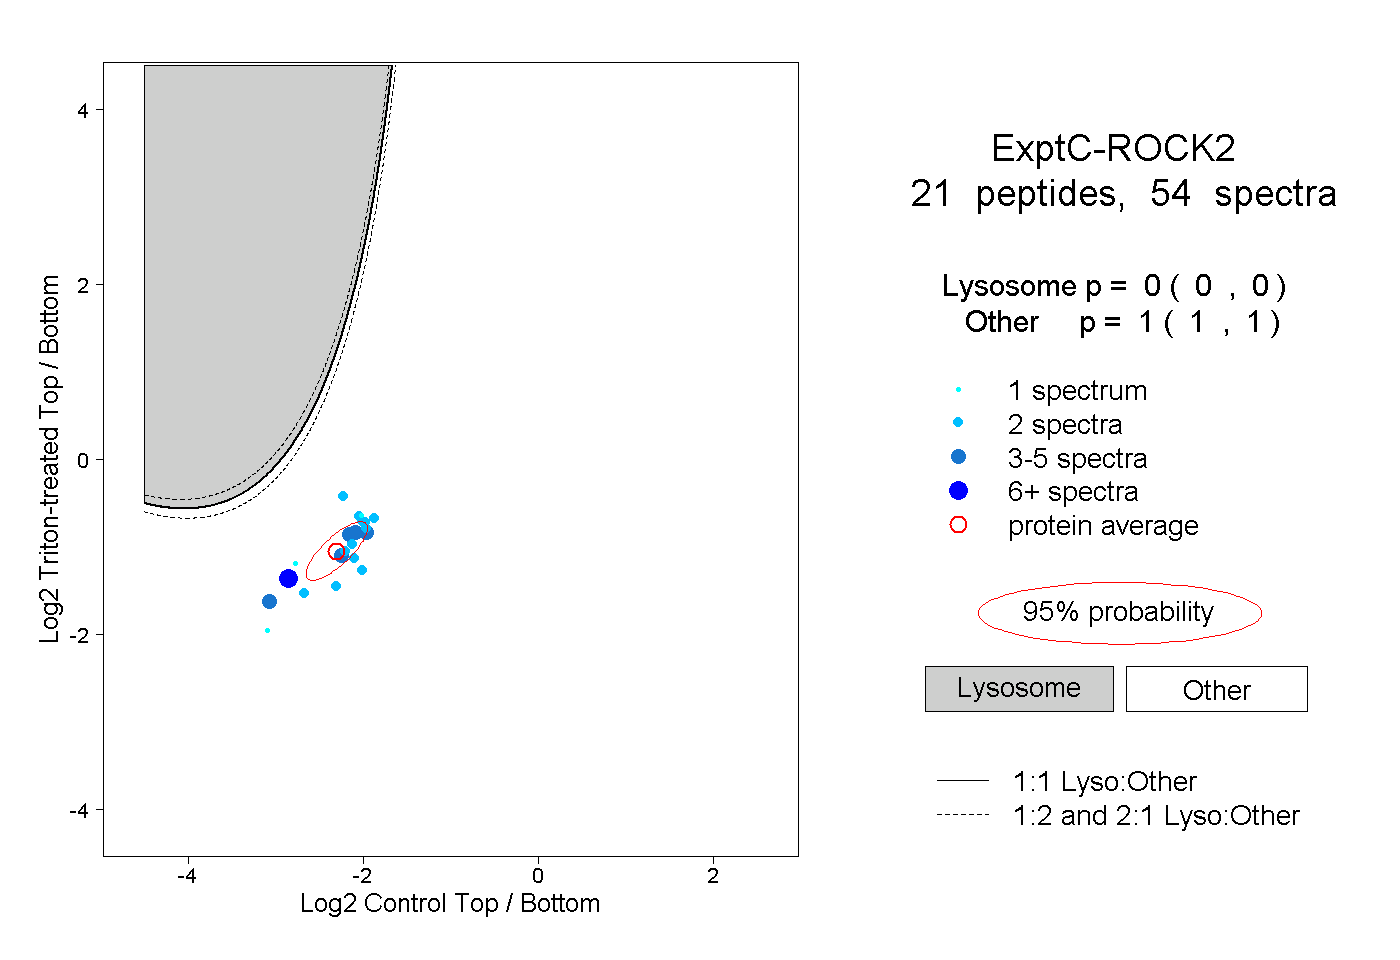
0.000 | 0.000
1.000 | 1.000
2peptides
spectra
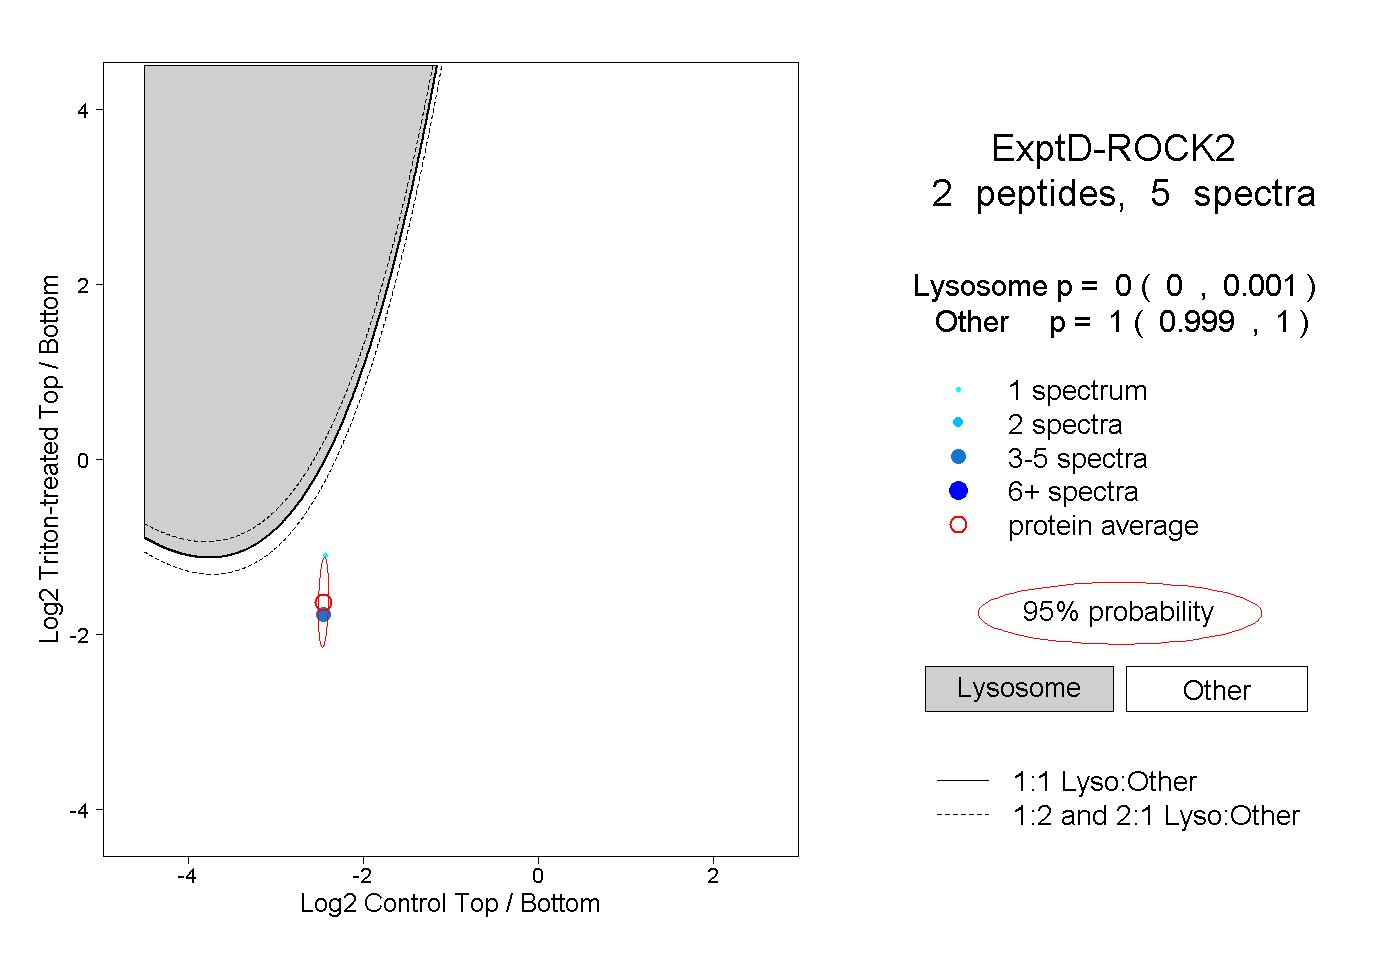
0.000 | 0.001
0.999 | 1.000