 8
8peptides
spectra
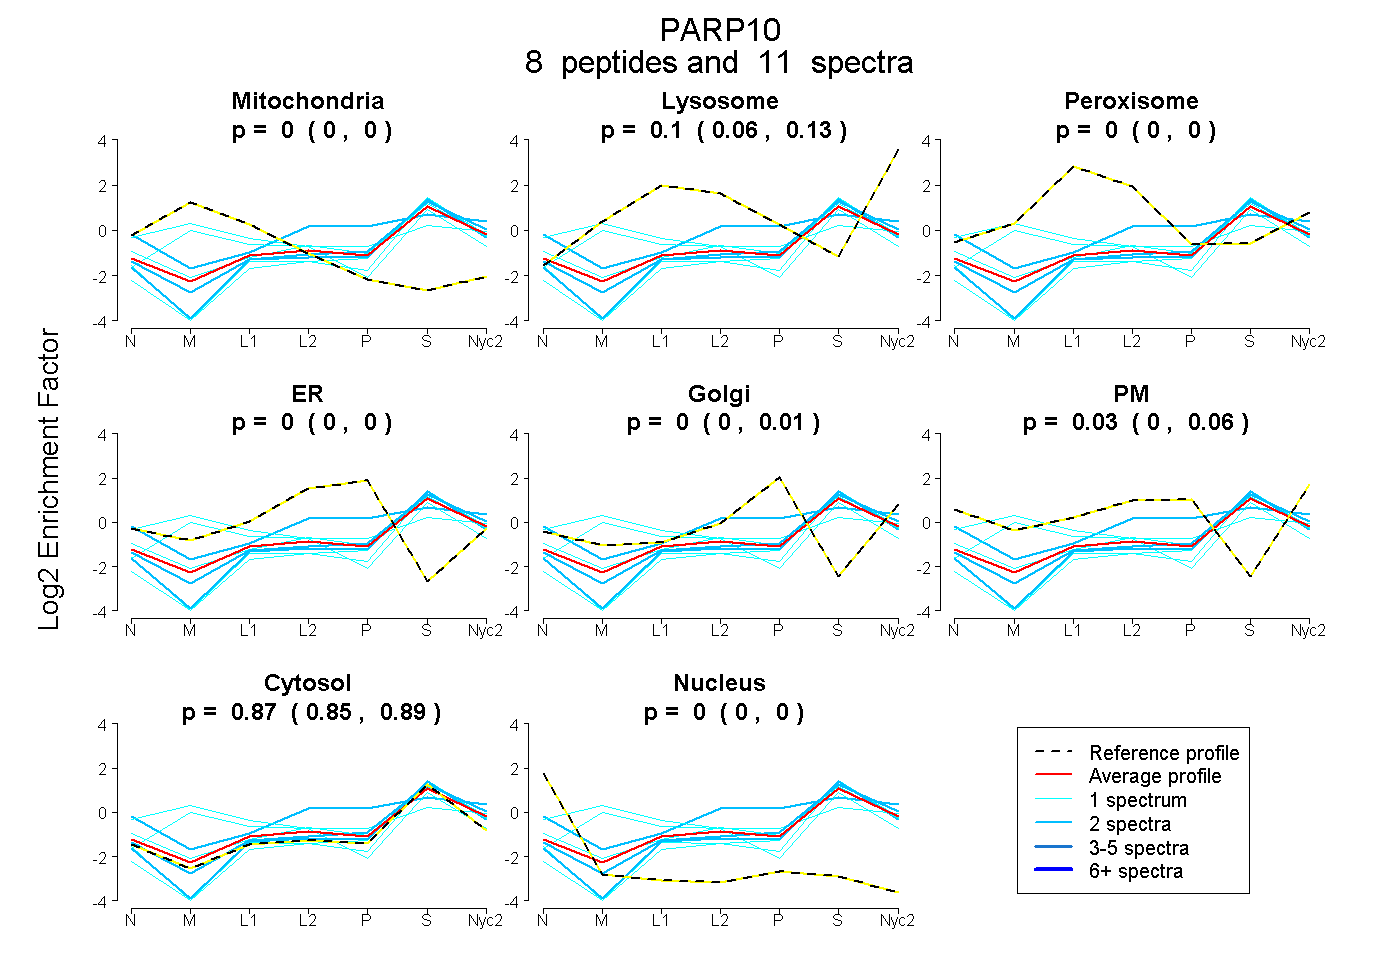
0.000 | 0.000
0.065 | 0.126
0.000 | 0.004
0.000 | 0.000
0.000 | 0.013
0.000 | 0.064
0.845 | 0.890
0.000 | 0.000
1peptide
spectrum
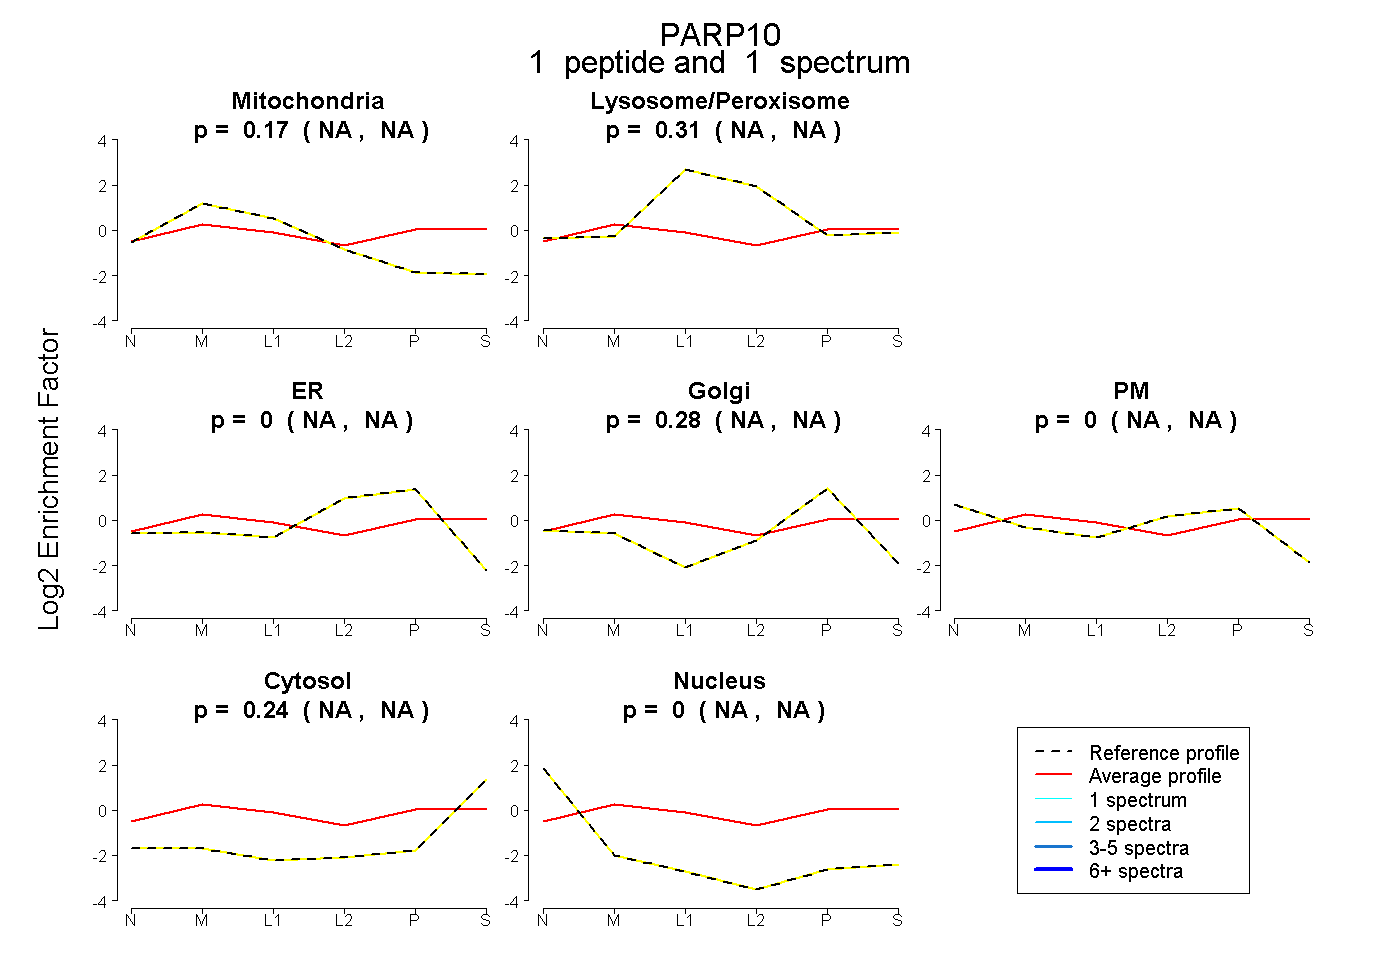
NA | NA
NA | NA
NA | NA
NA | NA
NA | NA
NA | NA
NA | NA
2peptides
spectra
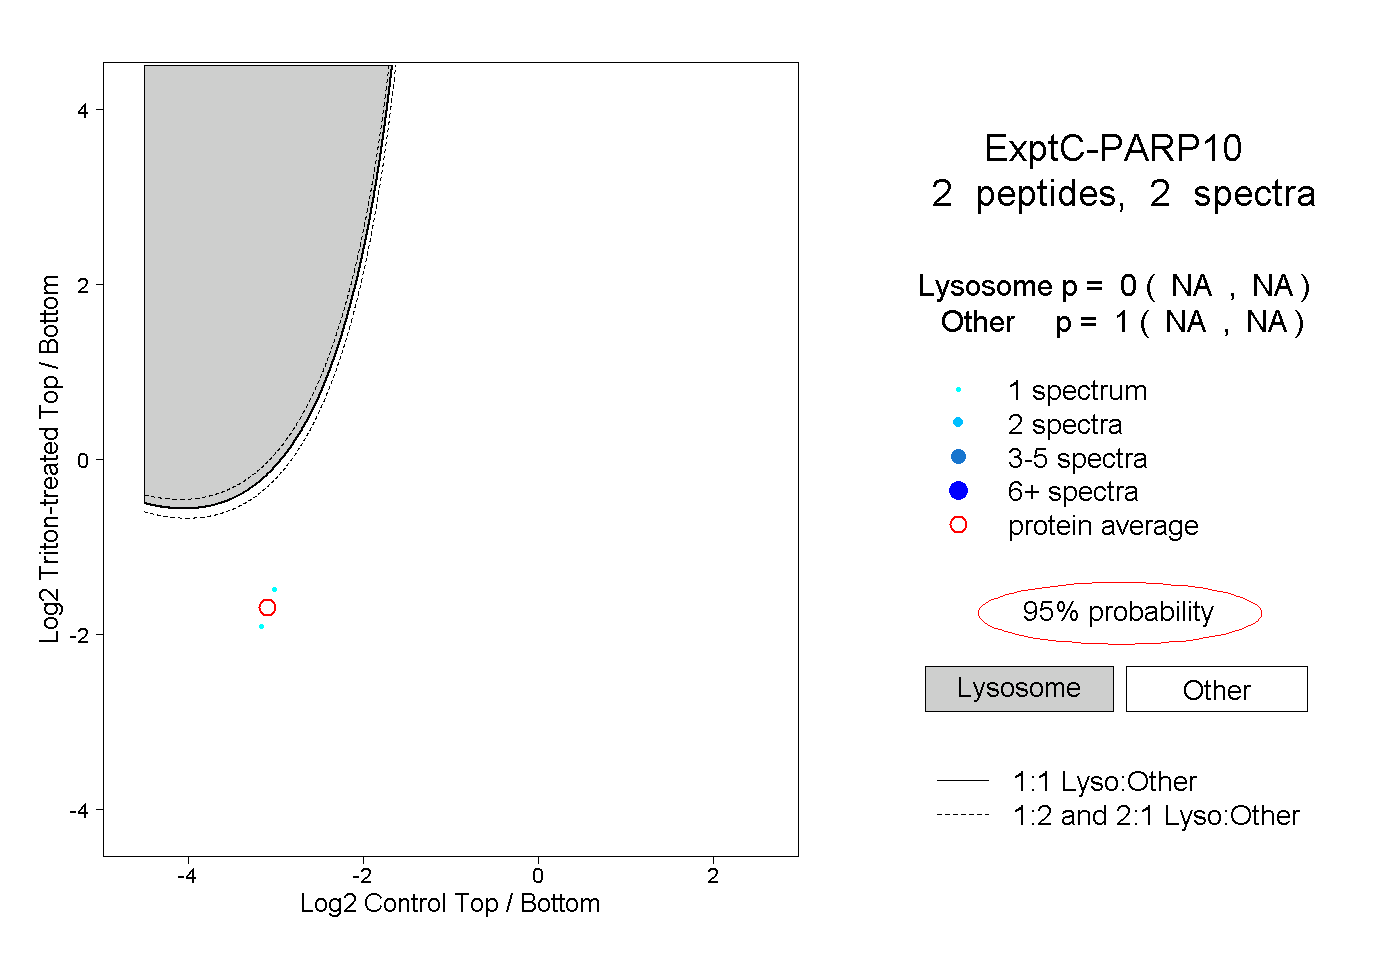
NA | NA
NA | NA