NSF
[ENSRNOP00000006361]
Main page
| | | Plot |
Mito |
Lyso |
|
Perox |
ER |
Golgi |
PM |
Cytosol |
Nucleus |
|
| Expt A |
 35
35
peptides |
129
spectra |
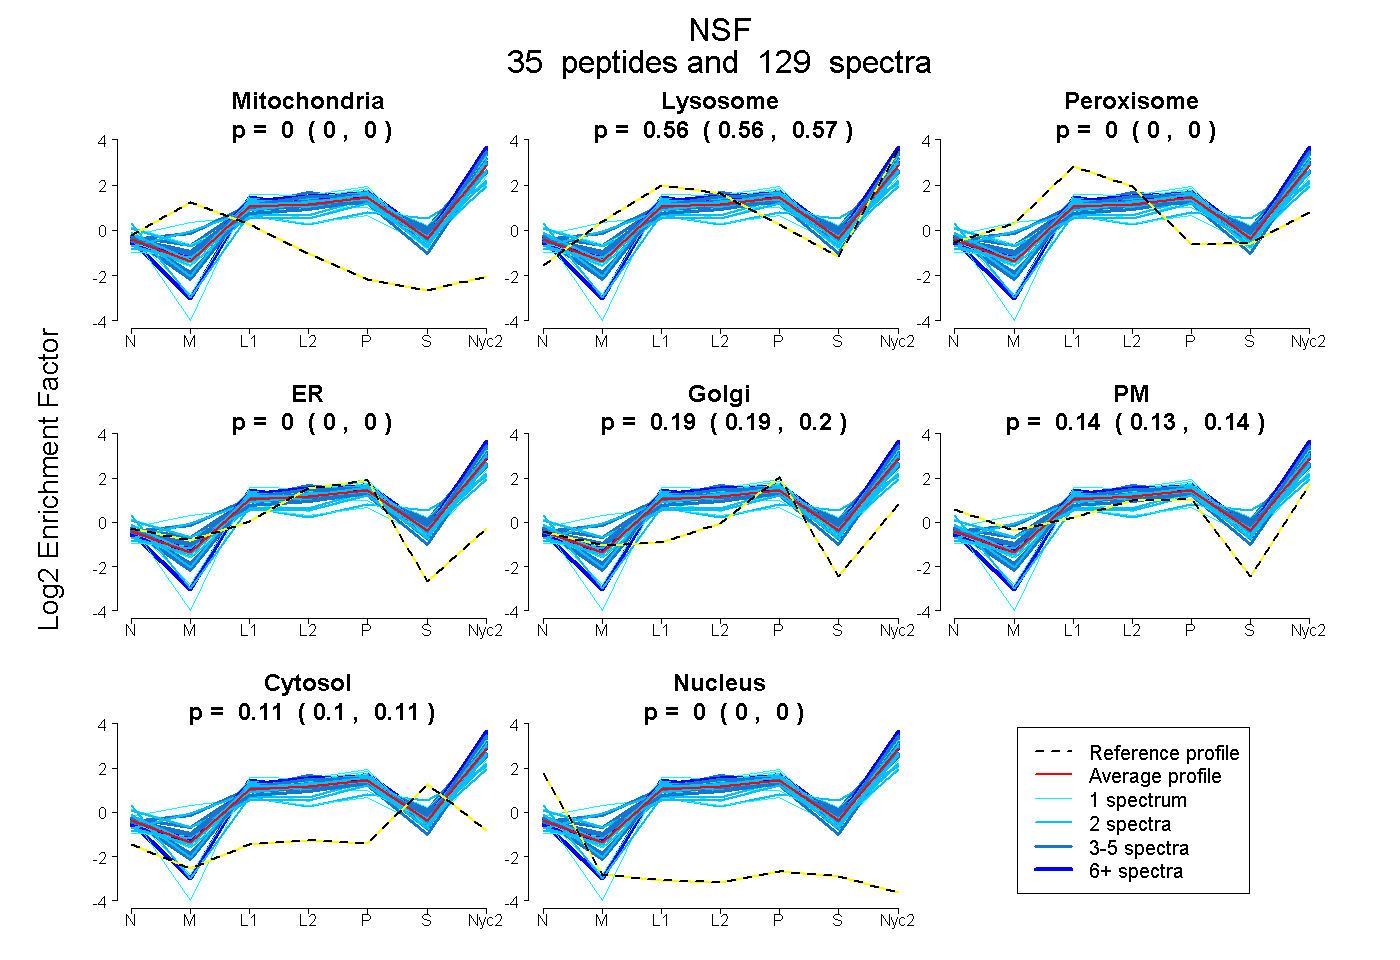 |
0.000
0.000 | 0.000 |
0.564
0.561 | 0.566 |
|
0.000
0.000 | 0.000 |
0.000
0.000 | 0.000 |
0.193
0.189 | 0.196 |
0.137
0.132 | 0.141 |
0.106
0.105 | 0.108 |
0.000
0.000 | 0.000 |
|
| | | Plot |
Mito |
|
Lyso or Perox |
|
ER |
Golgi |
PM |
Cytosol |
Nucleus |
|
| Expt B |
13
peptides |
31
spectra |
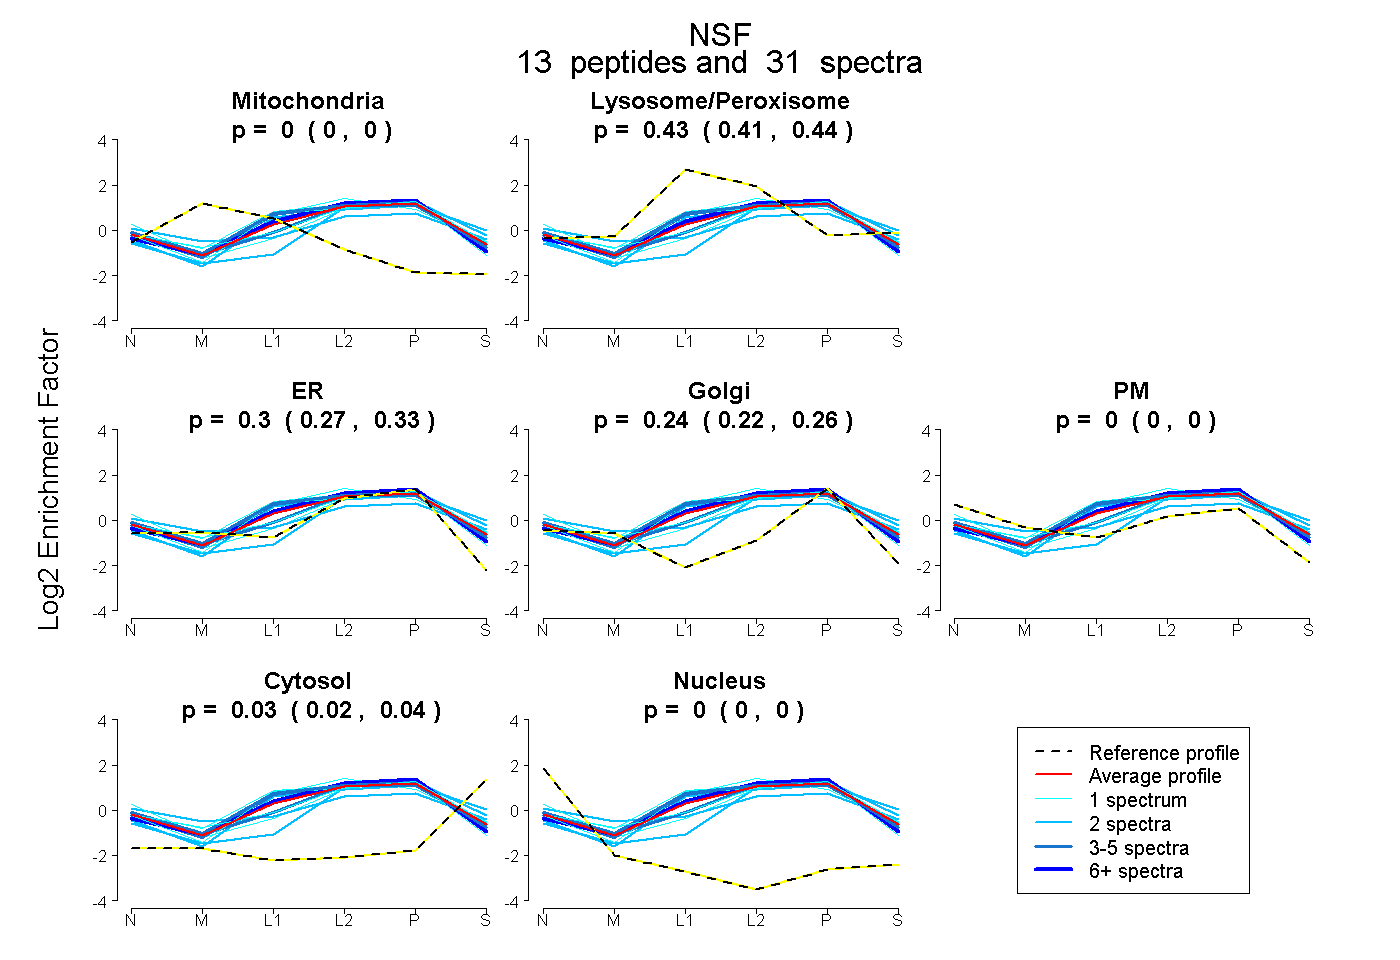 |
0.000
0.000 | 0.000 |
|
0.426
0.408 | 0.441 |
|
0.305
0.275 | 0.332 |
0.241
0.215 | 0.260 |
0.000
0.000 | 0.000 |
0.028
0.019 | 0.037 |
0.000
0.000 | 0.000 |
|
| | | Plot |
|
Lyso |
|
|
|
|
|
|
|
Other |
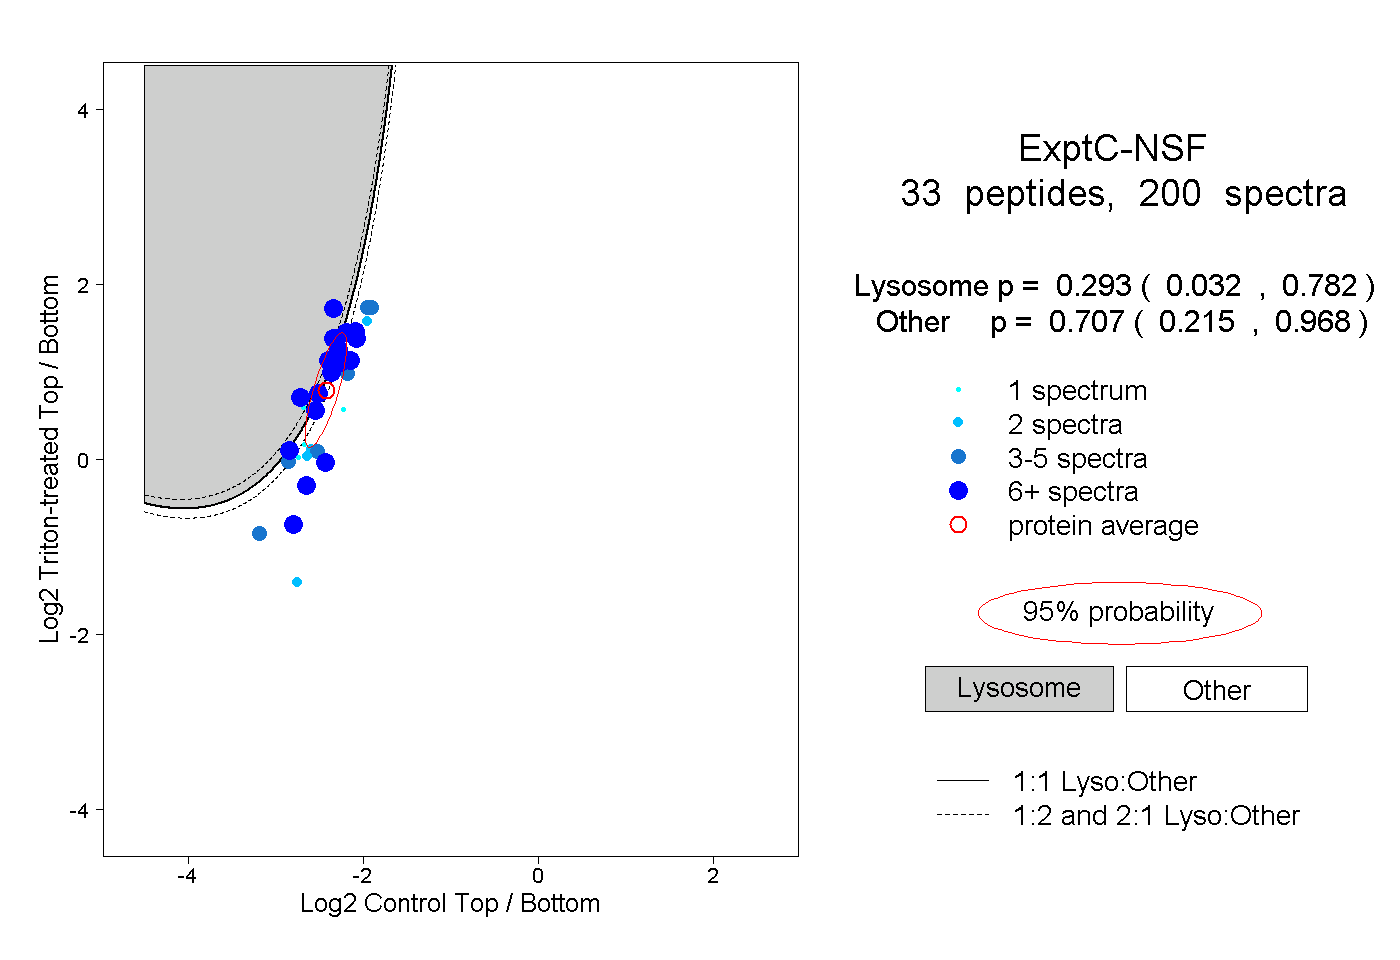
| Expt C |
33
peptides |
200
spectra |
 |
|
0.293
0.032 | 0.782 |
|
|
|
|
|
|
|
0.707
0.215 | 0.968 |
| | | Plot |
|
Lyso |
|
|
|
|
|
|
|
Other |
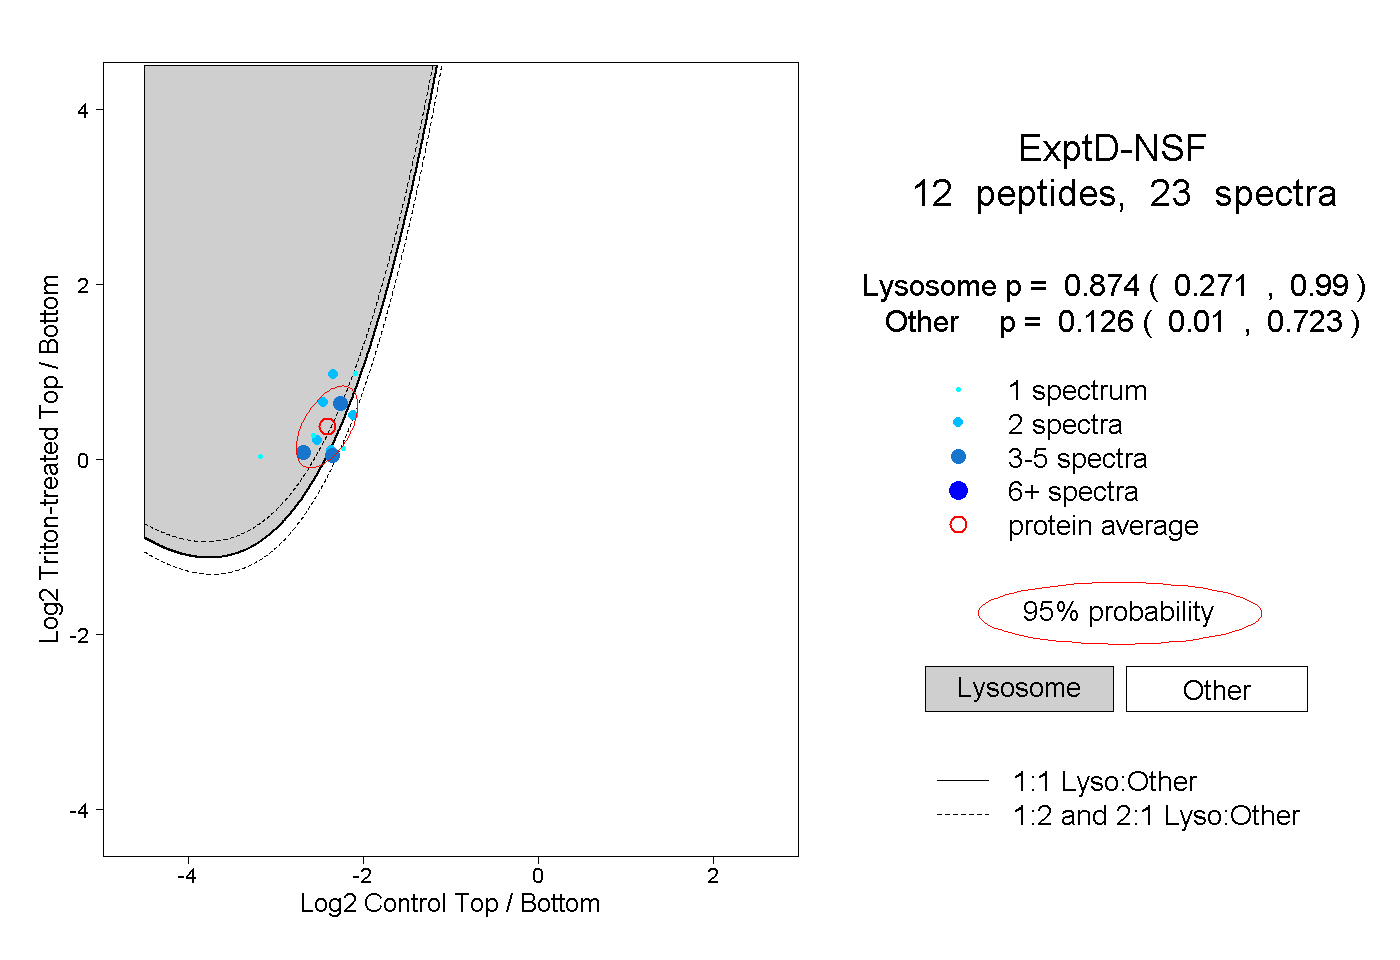
| Expt D |
12
peptides |
23
spectra |
 |
|
0.874
0.271 | 0.990 |
|
|
|
|
|
|
|
0.126
0.010 | 0.723 |
| 2 spectra, LLDYVPIGPR |
|
0.983 |
|
|
|
|
|
|
|
0.017 |
| 1 spectrum, LFADAEEEQR |
|
0.727 |
|
|
|
|
|
|
|
0.273 |
| 1 spectrum, DIEAMDPSILK |
|
0.998 |
|
|
|
|
|
|
|
0.002 |
| 1 spectrum, YVGESEANIR |
|
0.957 |
|
|
|
|
|
|
|
0.043 |
| 2 spectra, AENSSLNLIGK |
|
0.909 |
|
|
|
|
|
|
|
0.091 |
| 2 spectra, IAEESNFPFIK |
|
0.427 |
|
|
|
|
|
|
|
0.573 |
| 2 spectra, QSIINPDWNFEK |
|
0.213 |
|
|
|
|
|
|
|
0.787 |
| 1 spectrum, LFGLLVK |
|
0.137 |
|
|
|
|
|
|
|
0.863 |
| 3 spectra, VVNGPEILNK |
|
0.329 |
|
|
|
|
|
|
|
0.671 |
| 2 spectra, SQLSCVVVDDIER |
|
0.989 |
|
|
|
|
|
|
|
0.011 |
| 3 spectra, TTIAQQVK |
|
0.957 |
|
|
|
|
|
|
|
0.043 |
| 3 spectra, IFDDAYK |
|
0.818 |
|
|
|
|
|
|
|
0.182 |