35
35peptides
spectra
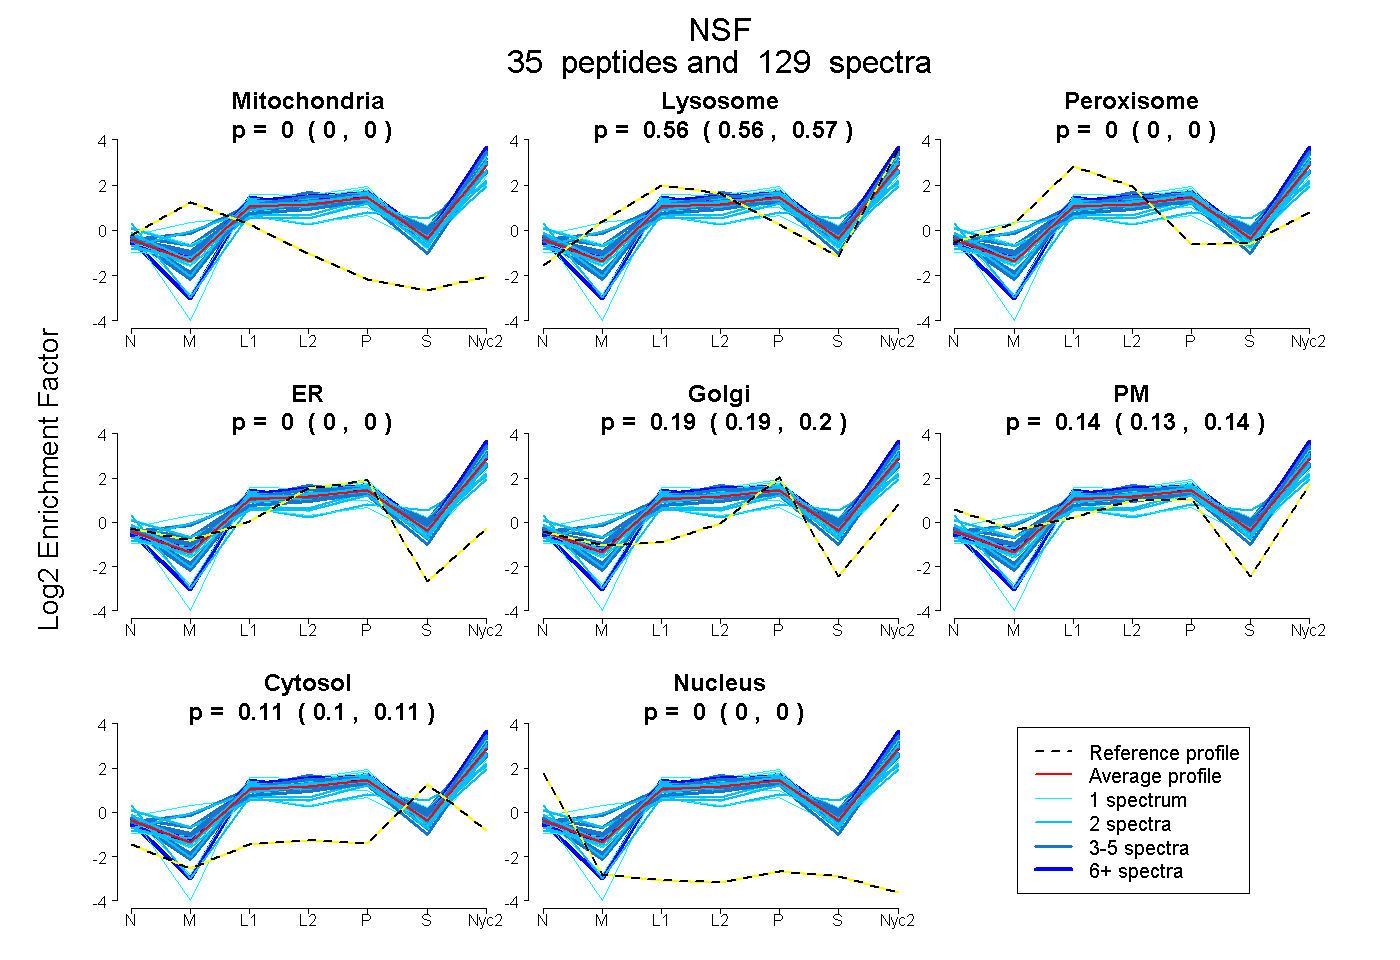
0.000 | 0.000
0.561 | 0.566
0.000 | 0.000
0.000 | 0.000
0.189 | 0.196
0.132 | 0.141
0.105 | 0.108
0.000 | 0.000
13peptides
spectra
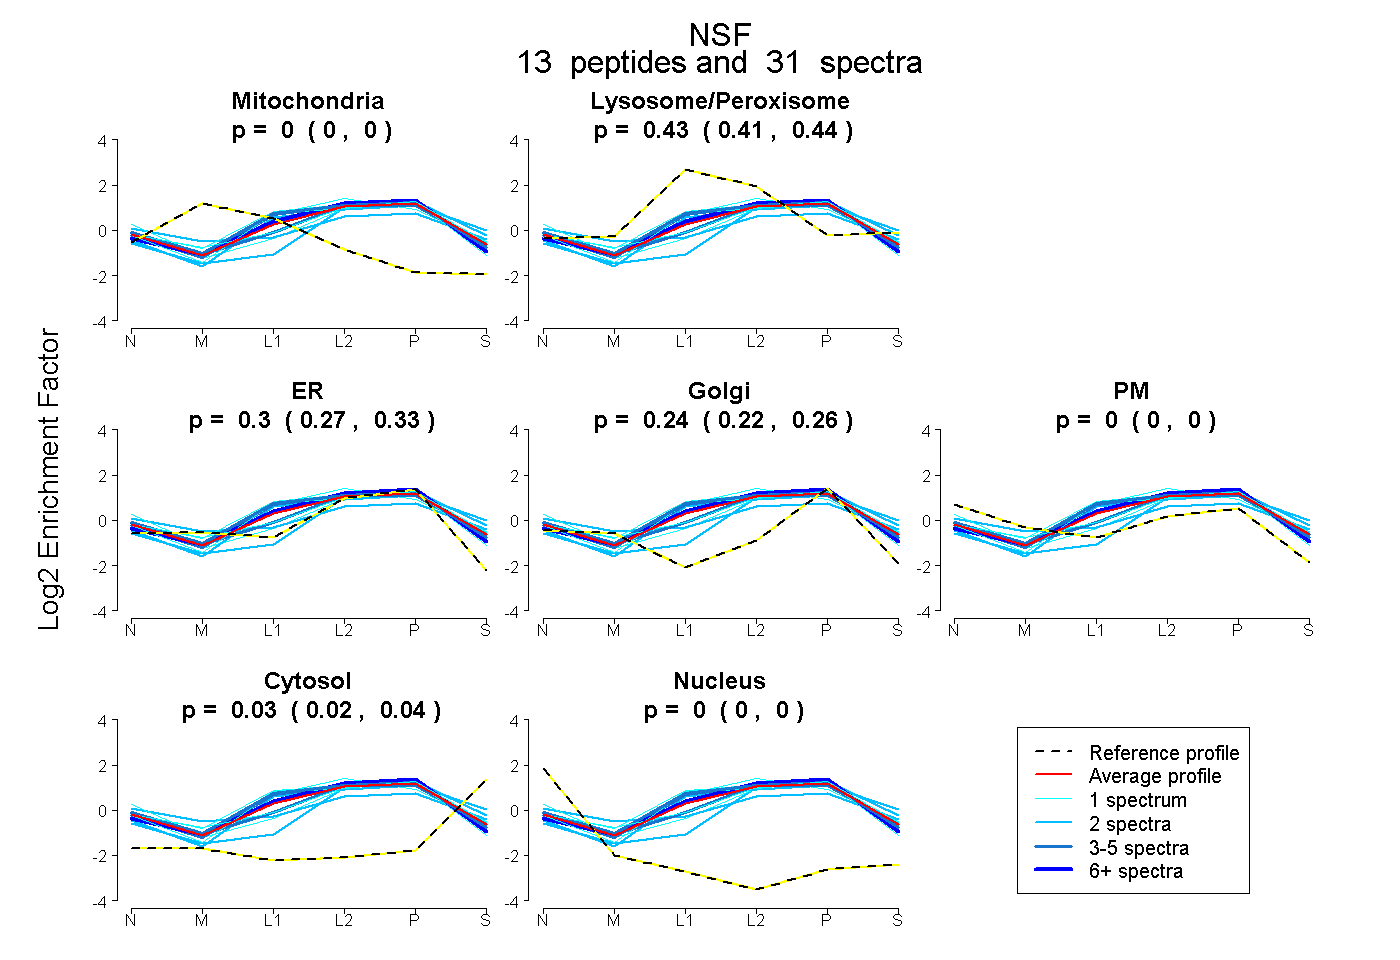
0.000 | 0.000
0.408 | 0.441
0.275 | 0.332
0.215 | 0.260
0.000 | 0.000
0.019 | 0.037
0.000 | 0.000