9
9peptides
spectra
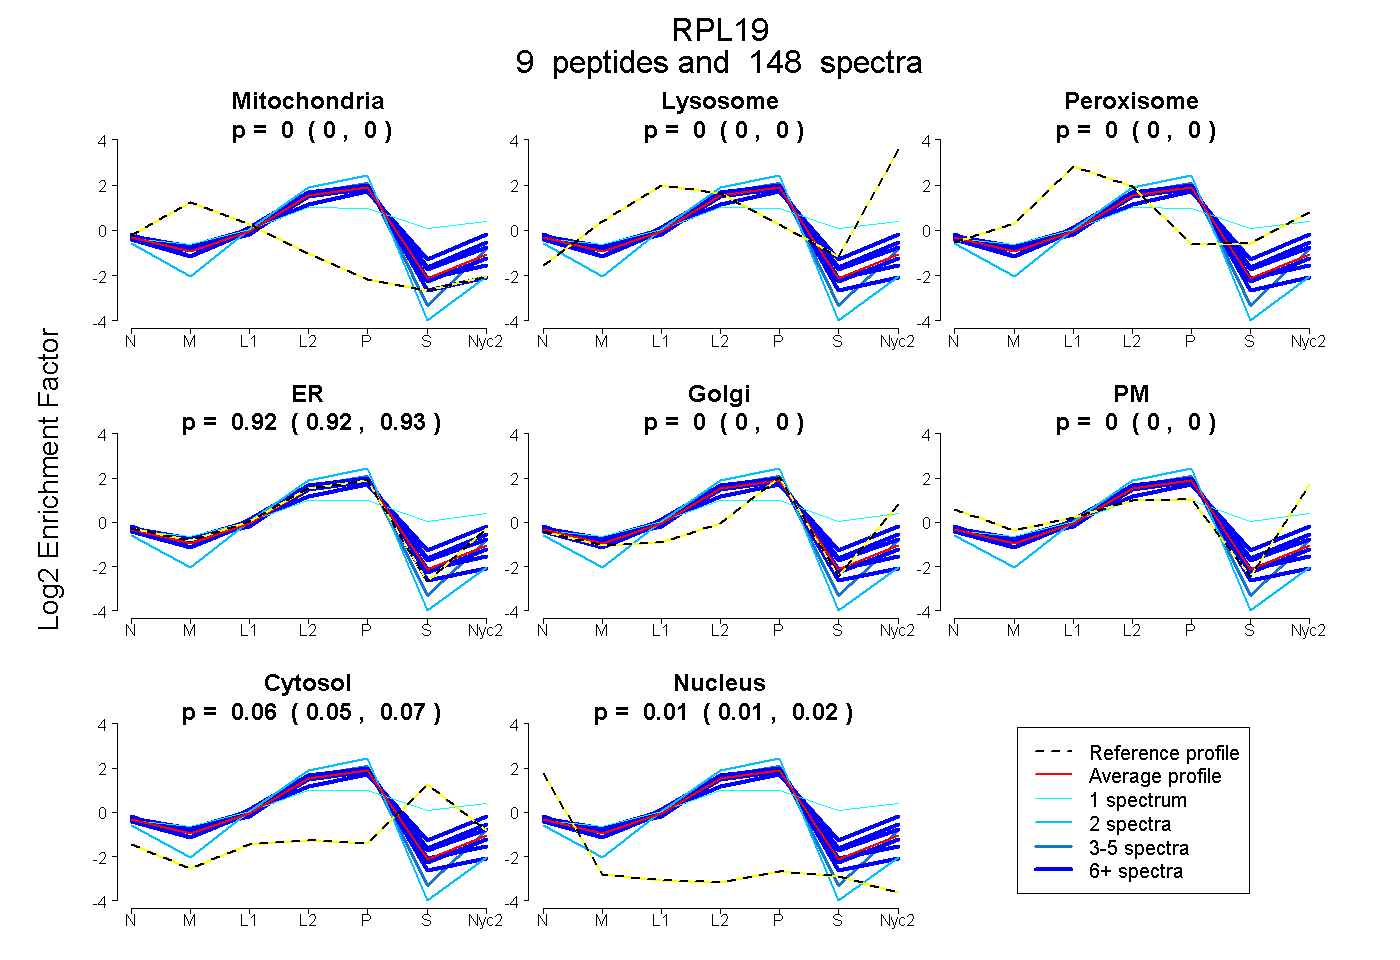
0.000 | 0.000
0.000 | 0.000
0.000 | 0.000
0.920 | 0.927
0.000 | 0.000
0.000 | 0.000
0.054 | 0.069
0.009 | 0.018
8peptides
spectra
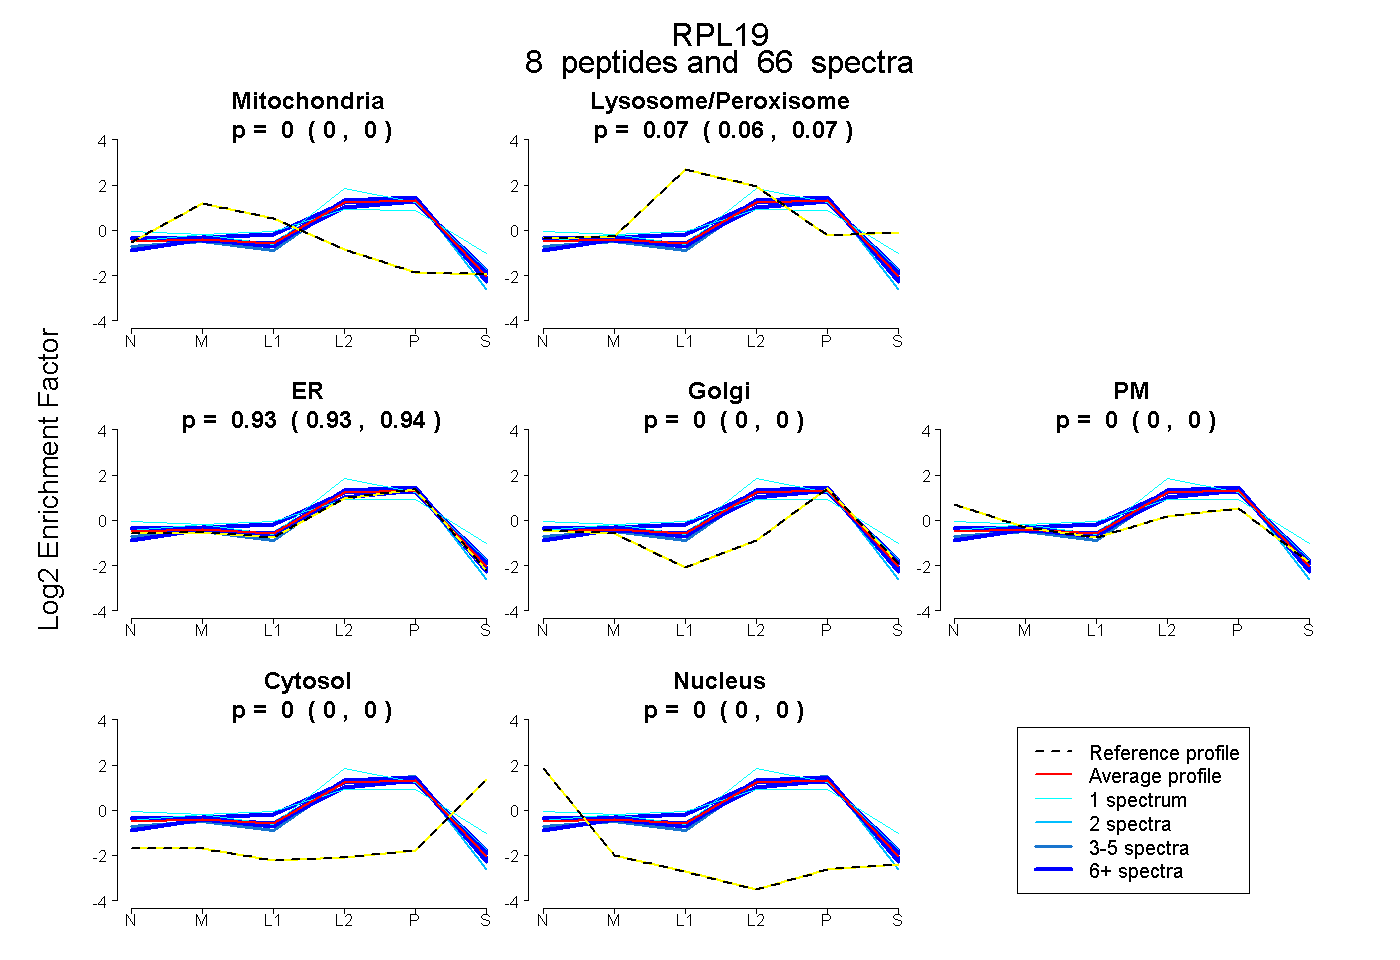
0.000 | 0.000
0.063 | 0.072
0.928 | 0.936
0.000 | 0.000
0.000 | 0.000
0.000 | 0.000
0.000 | 0.000
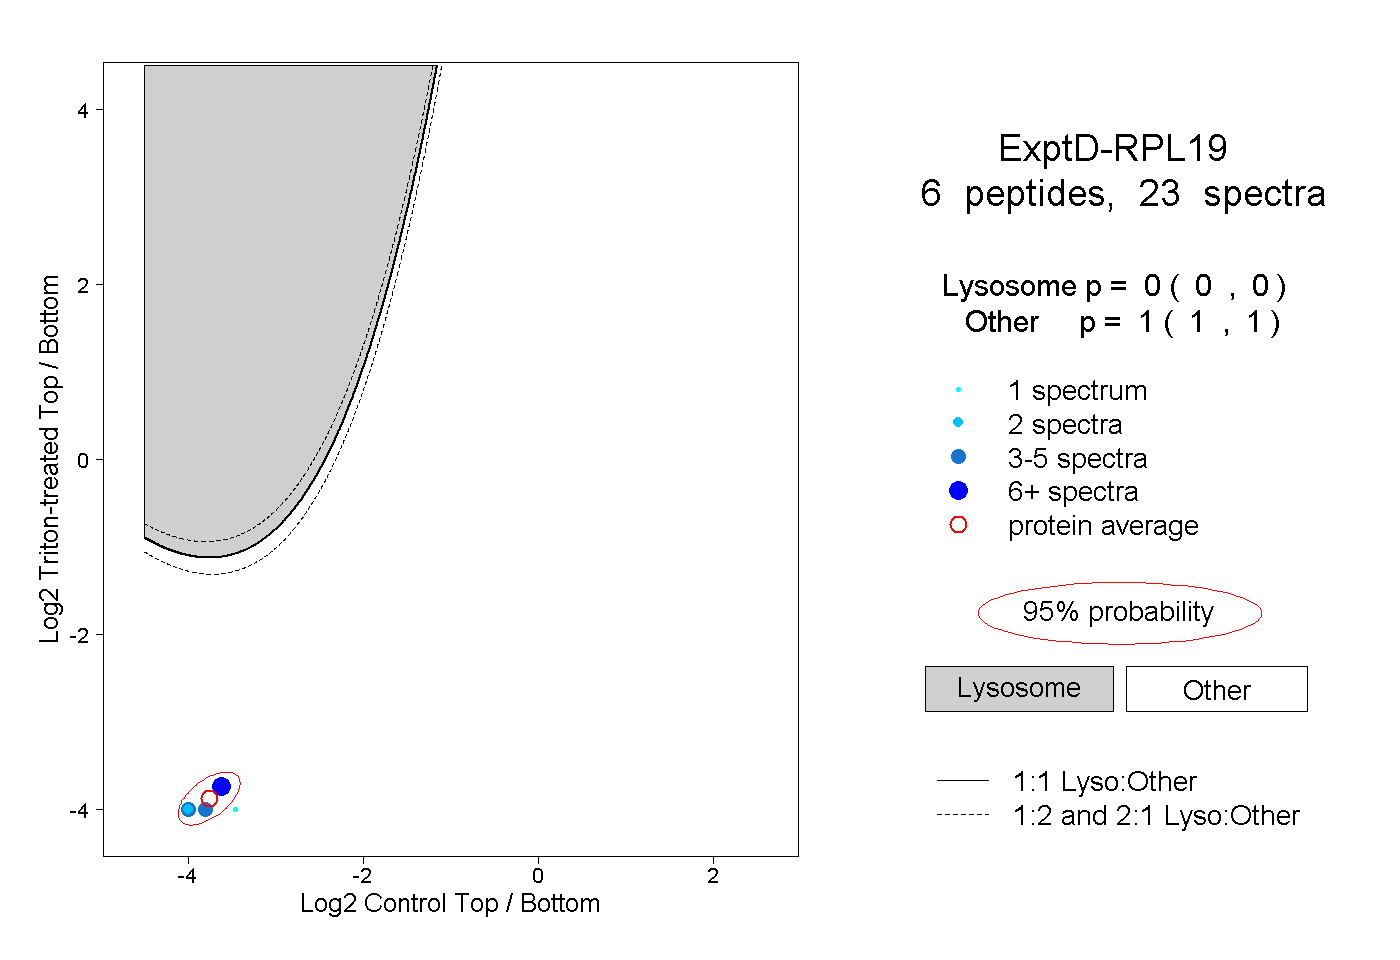
7peptides
spectra
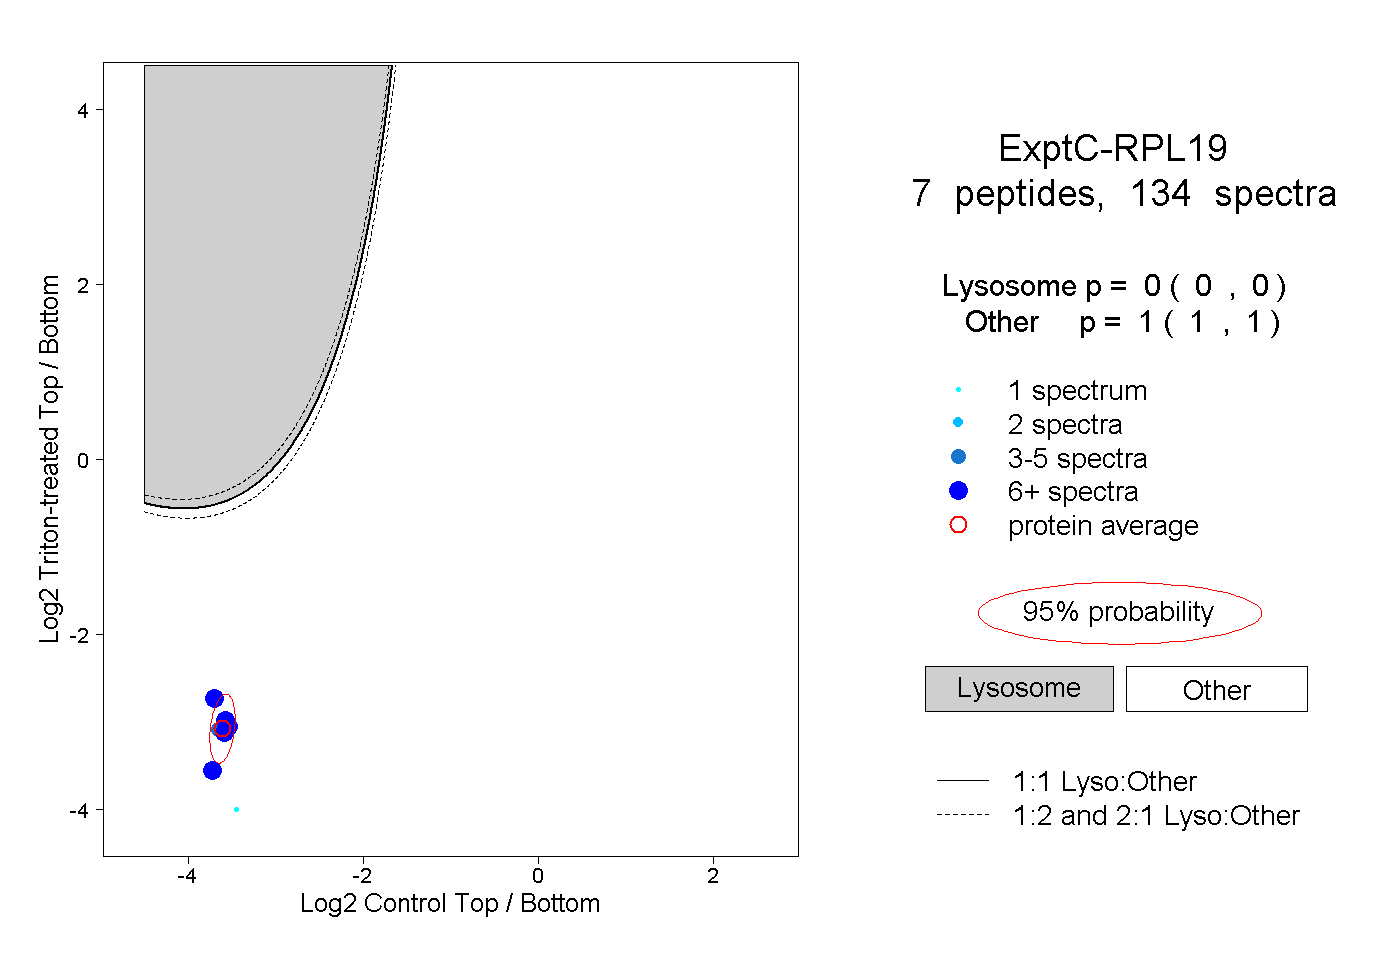
0.000 | 0.000
1.000 | 1.000