 9
9peptides
spectra
0.000 | 0.000
0.000 | 0.000
0.000 | 0.000
0.920 | 0.927
0.000 | 0.000
0.000 | 0.000
0.054 | 0.069
0.009 | 0.018
| Plot | Mito | Lyso | Perox | ER | Golgi | PM | Cytosol | Nucleus | |||||
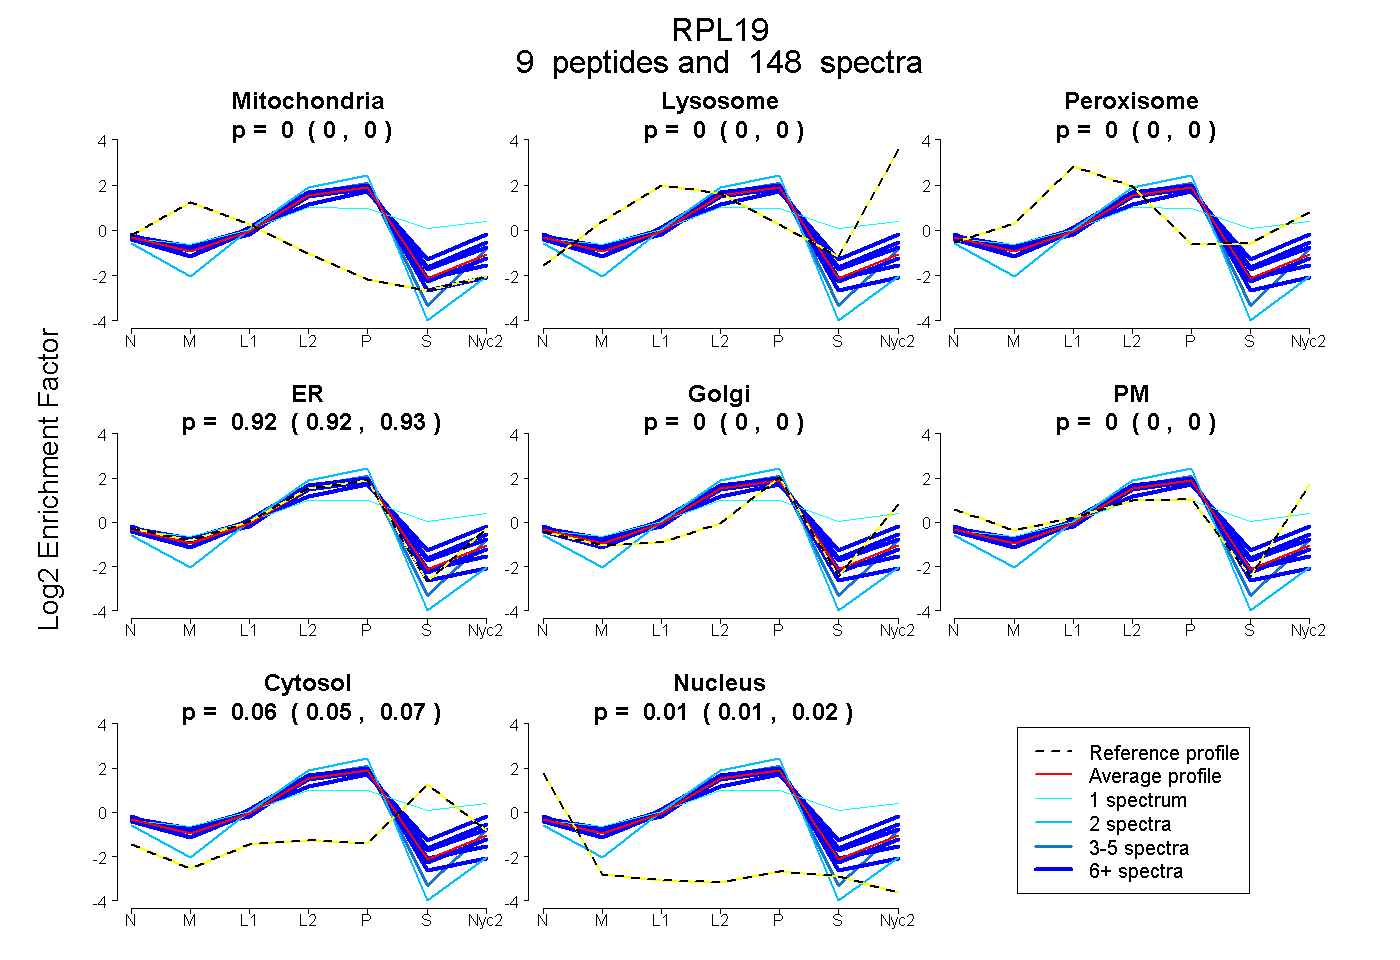
| Expt A |
9 peptides |
148 spectra |
|
0.000 0.000 | 0.000 |
0.000 0.000 | 0.000 |
0.000 0.000 | 0.000 |
0.924 0.920 | 0.927 |
0.000 0.000 | 0.000 |
0.000 0.000 | 0.000 |
0.062 0.054 | 0.069 |
0.014 0.009 | 0.018 |
| 34 spectra, KPVTVHSR | 0.000 | 0.000 | 0.000 | 0.919 | 0.000 | 0.000 | 0.000 | 0.081 | ||
| 32 spectra, ILMEHIHK | 0.000 | 0.000 | 0.000 | 0.912 | 0.000 | 0.000 | 0.053 | 0.035 | ||
| 4 spectra, DGILLR | 0.000 | 0.000 | 0.000 | 0.982 | 0.000 | 0.000 | 0.000 | 0.018 | ||
| 16 spectra, HMGIGK | 0.016 | 0.000 | 0.000 | 0.935 | 0.000 | 0.000 | 0.025 | 0.024 | ||
| 14 spectra, HMYHSLYLK | 0.000 | 0.000 | 0.108 | 0.675 | 0.083 | 0.000 | 0.134 | 0.000 | ||
| 20 spectra, LLADQAEAR | 0.000 | 0.000 | 0.016 | 0.866 | 0.000 | 0.000 | 0.119 | 0.000 | ||
| 1 spectrum, VWLDPNETNEIANANSR | 0.000 | 0.104 | 0.198 | 0.295 | 0.081 | 0.035 | 0.287 | 0.000 | ||
| 2 spectra, VTWMR | 0.000 | 0.000 | 0.000 | 0.942 | 0.000 | 0.000 | 0.000 | 0.058 | ||
| 25 spectra, LASSVLR | 0.000 | 0.000 | 0.003 | 0.887 | 0.000 | 0.000 | 0.110 | 0.000 |
| Plot | Mito | Lyso or Perox | ER | Golgi | PM | Cytosol | Nucleus | ||||||
| Expt B |
8 peptides |
66 spectra |
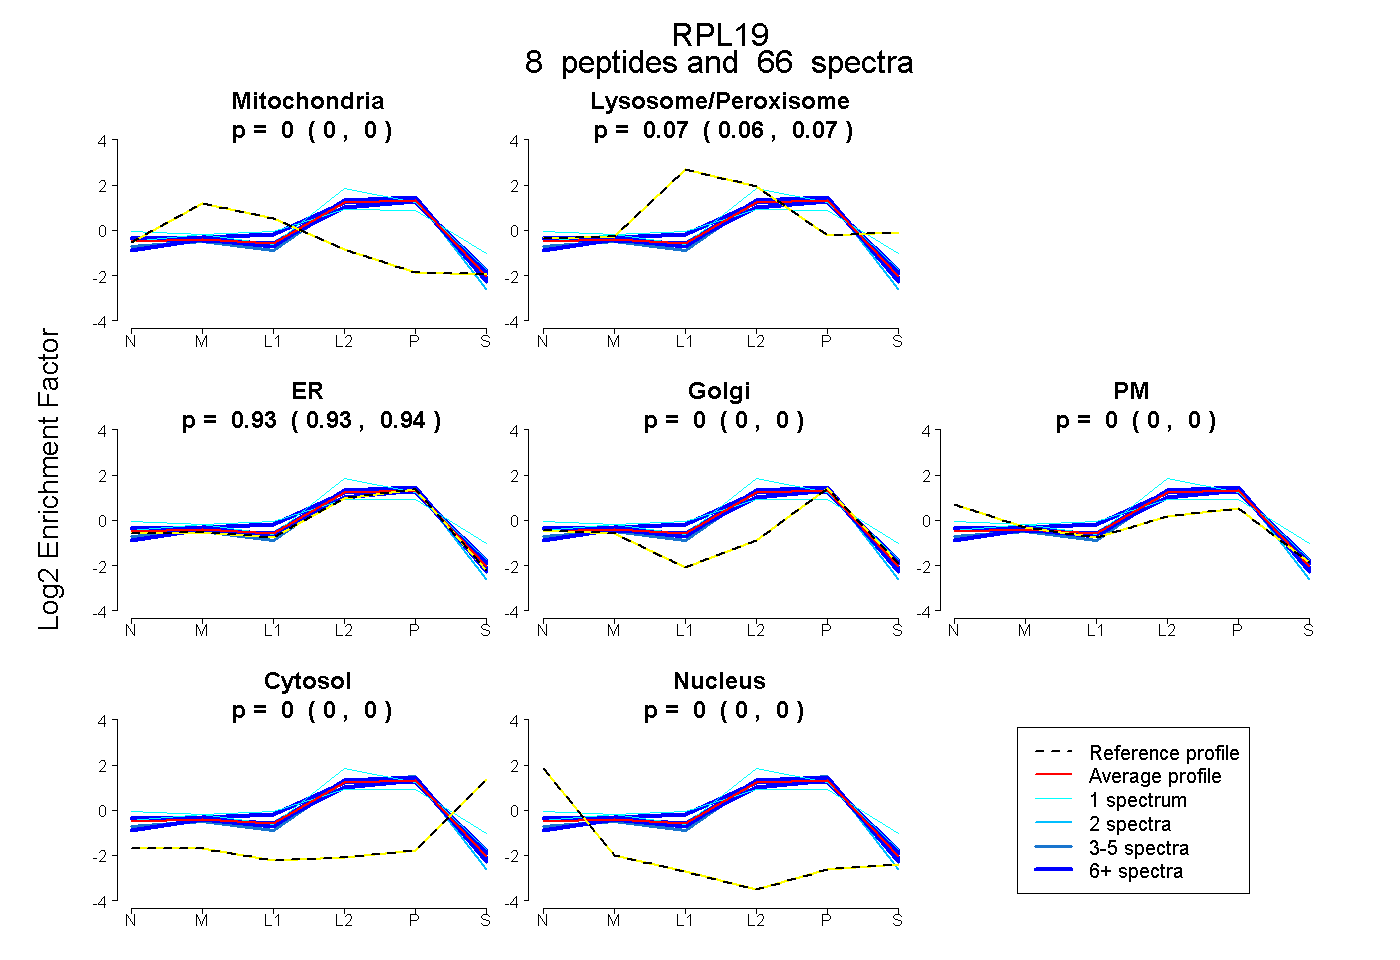 |
0.000 0.000 | 0.000 |
0.068 0.063 | 0.072 |
0.932 0.928 | 0.936 |
0.000 0.000 | 0.000 |
0.000 0.000 | 0.000 |
0.000 0.000 | 0.000 |
0.000 0.000 | 0.000 |
|||
| Plot | Lyso | Other | |||||||||||
| Expt C |
7 peptides |
134 spectra |
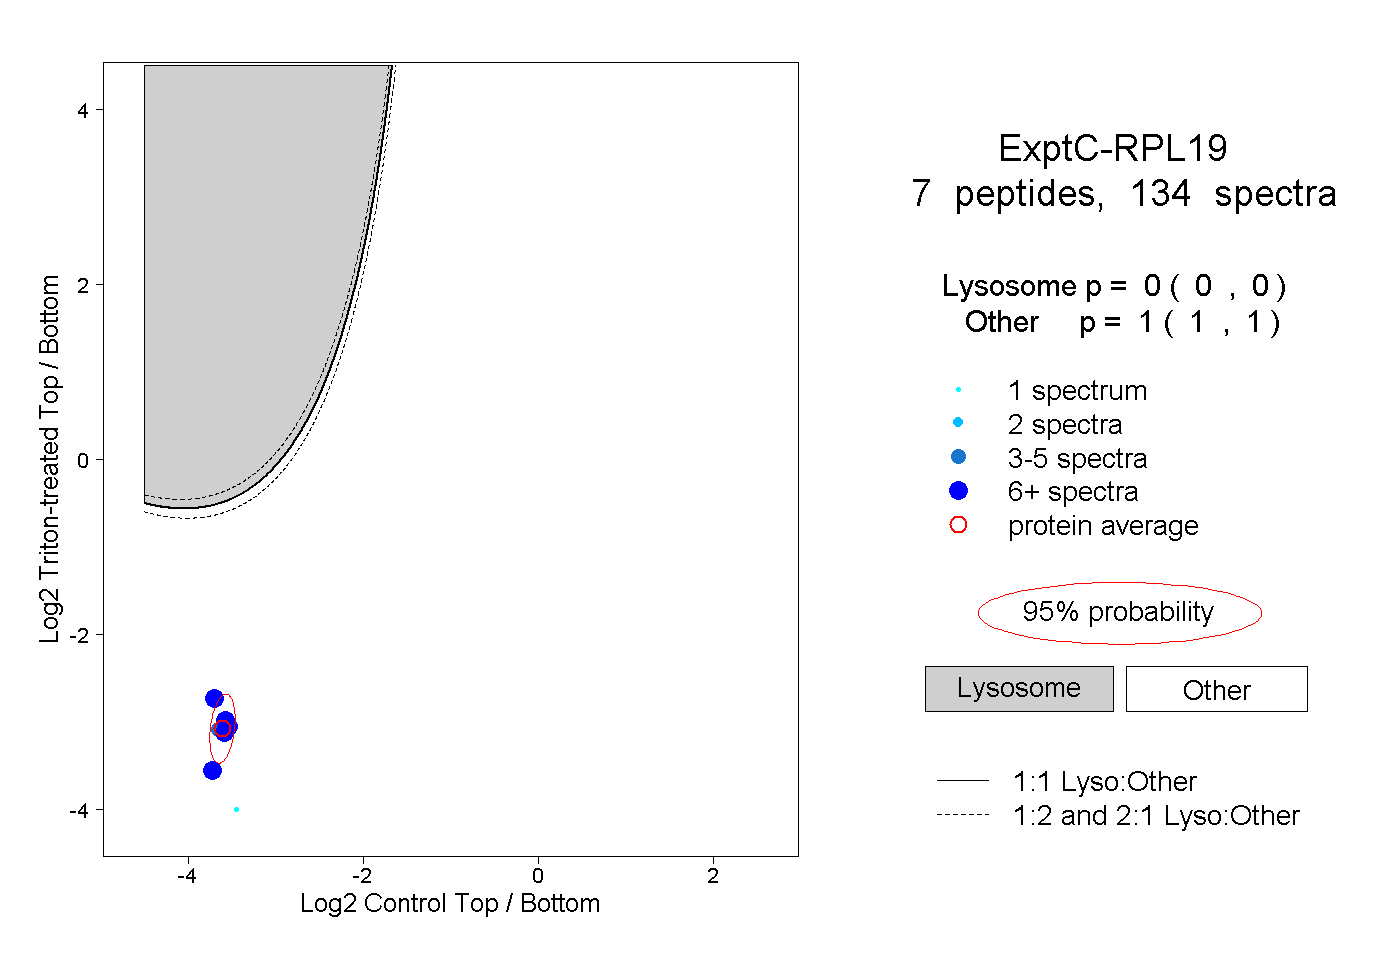 |
0.000 0.000 | 0.000 |
1.000 1.000 | 1.000 |
||||||||
| Plot | Lyso | Other | |||||||||||
| Expt D |
6 peptides |
23 spectra |
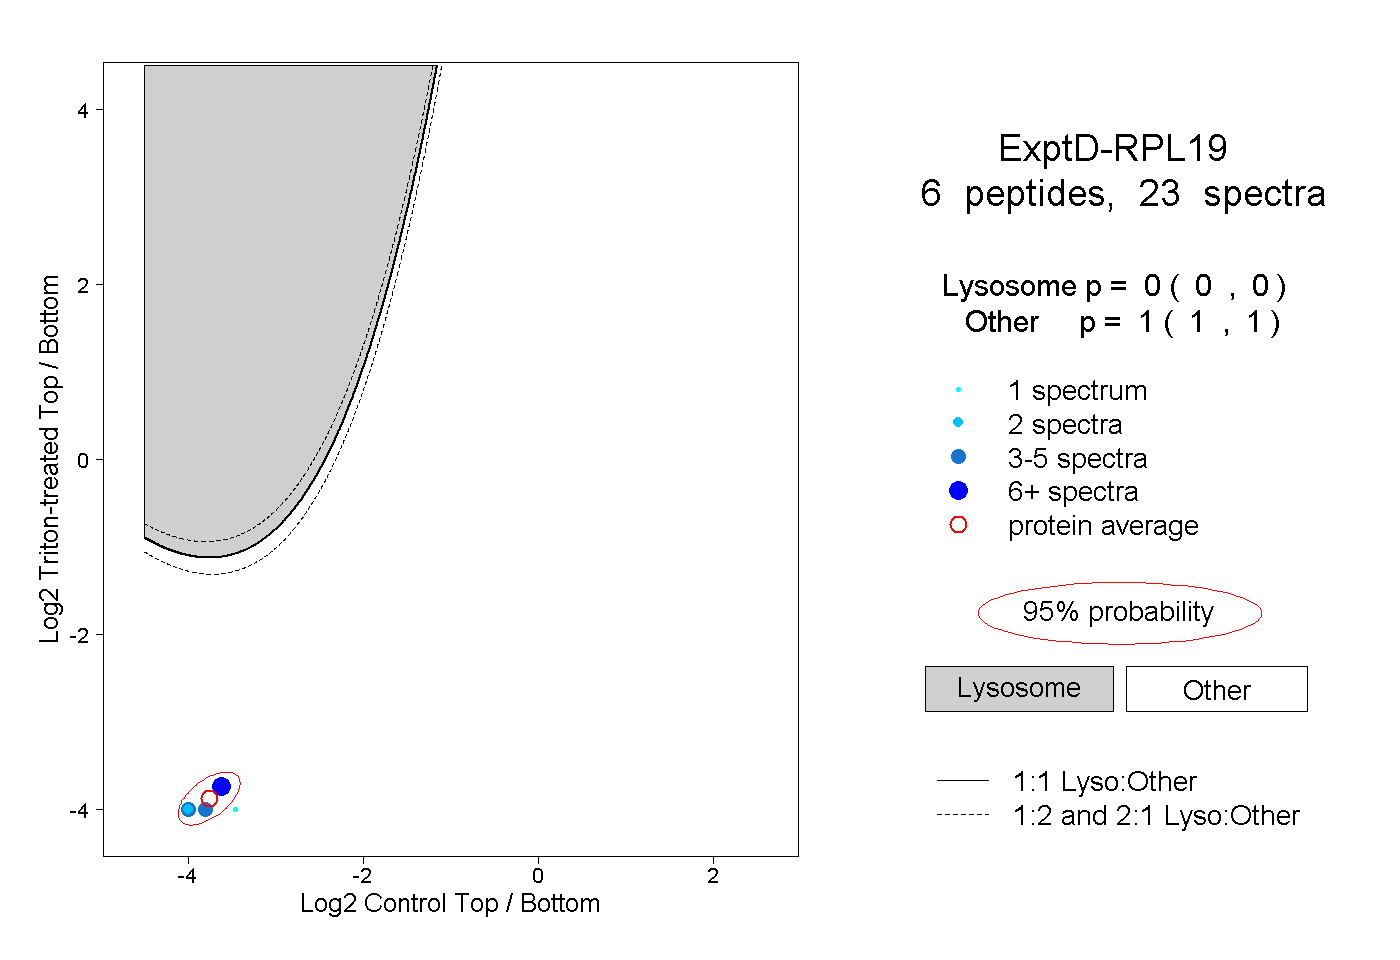 |
0.000 0.000 | 0.000 |
1.000 1.000 | 1.000 |