 18
18peptides
spectra
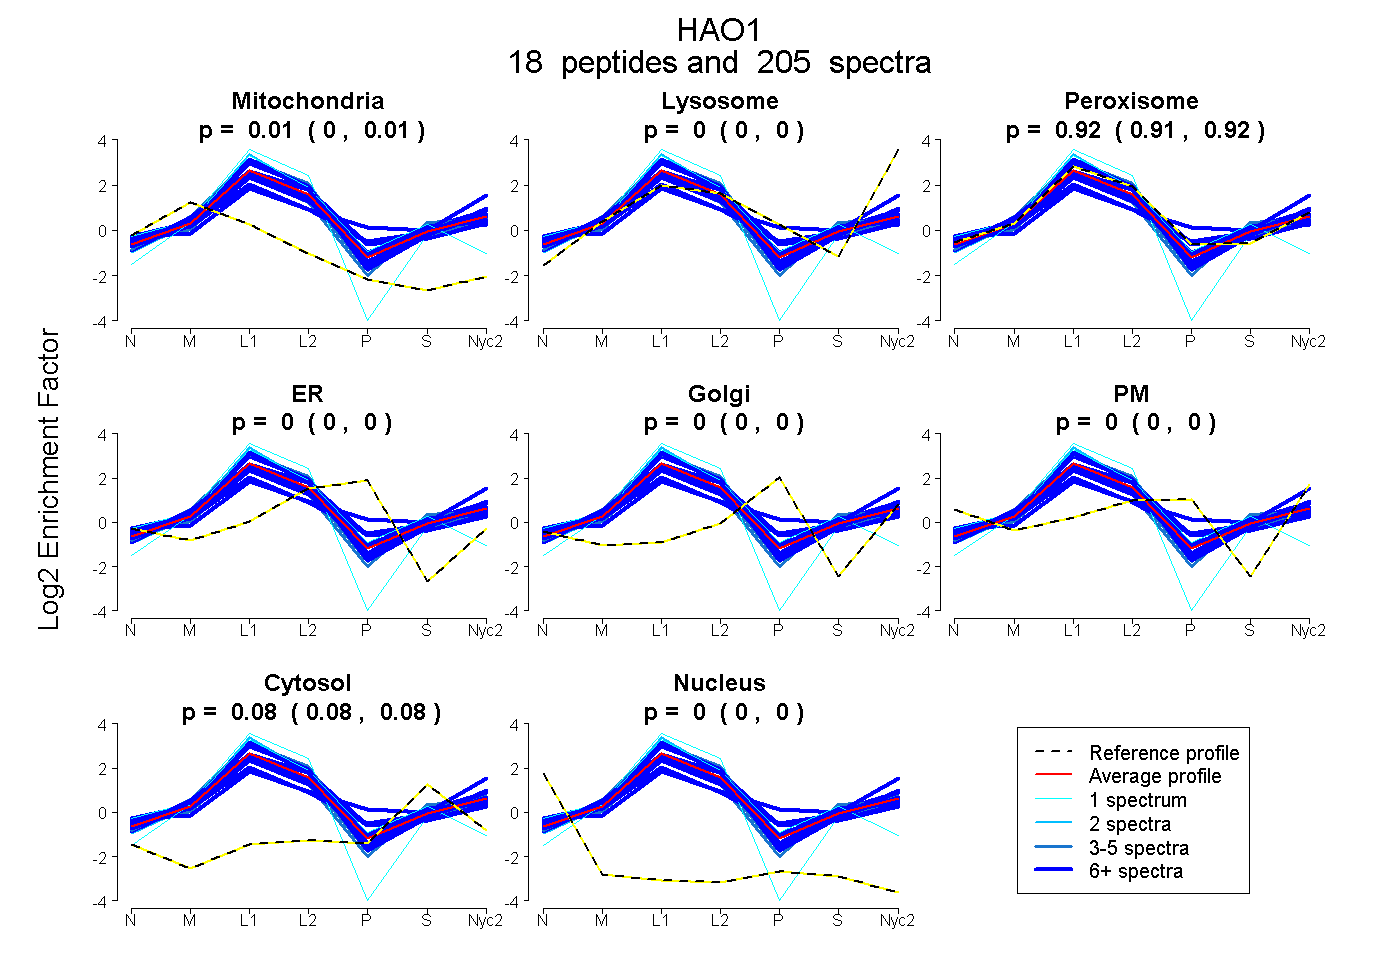
0.003 | 0.007
0.000 | 0.000
0.913 | 0.918
0.000 | 0.000
0.000 | 0.000
0.000 | 0.000
0.077 | 0.080
0.000 | 0.000
21peptides
spectra
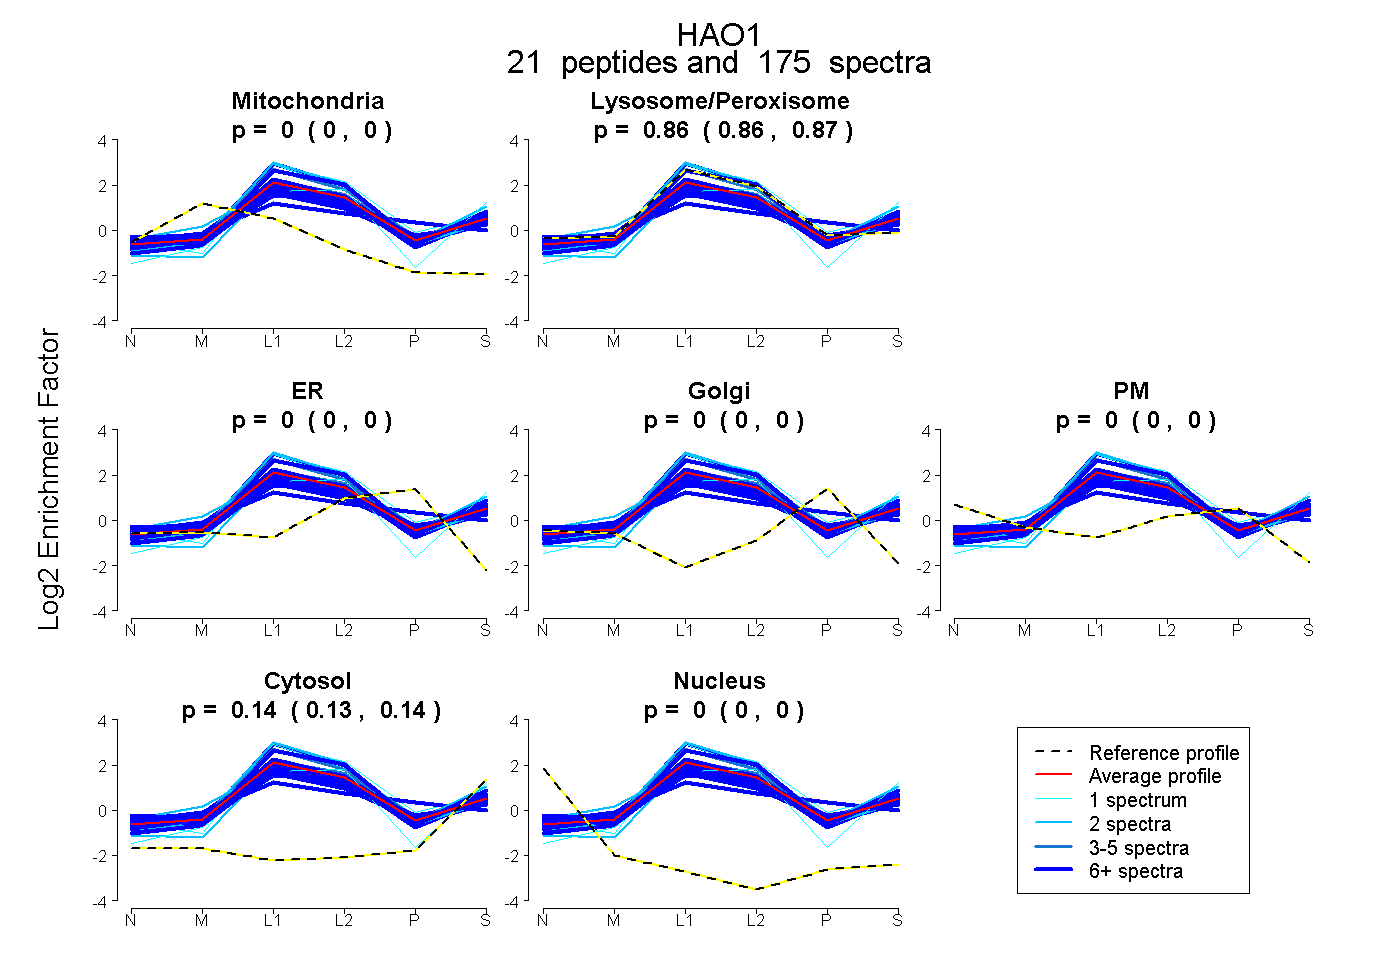
0.000 | 0.000
0.861 | 0.865
0.000 | 0.000
0.000 | 0.000
0.000 | 0.000
0.135 | 0.139
0.000 | 0.000
21peptides
spectra
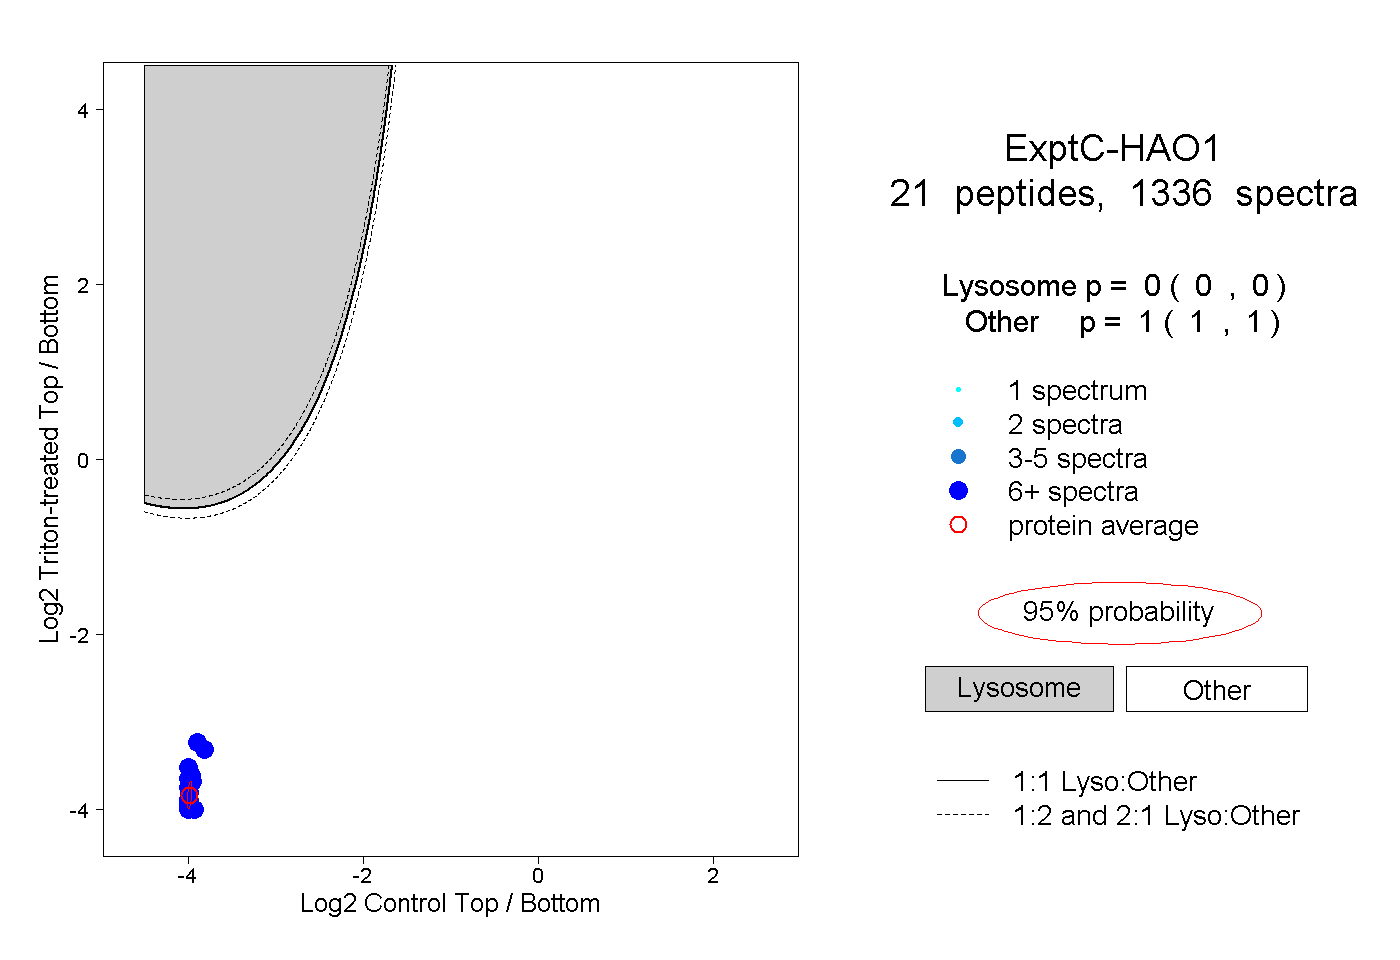
0.000 | 0.000
1.000 | 1.000
16peptides
spectra
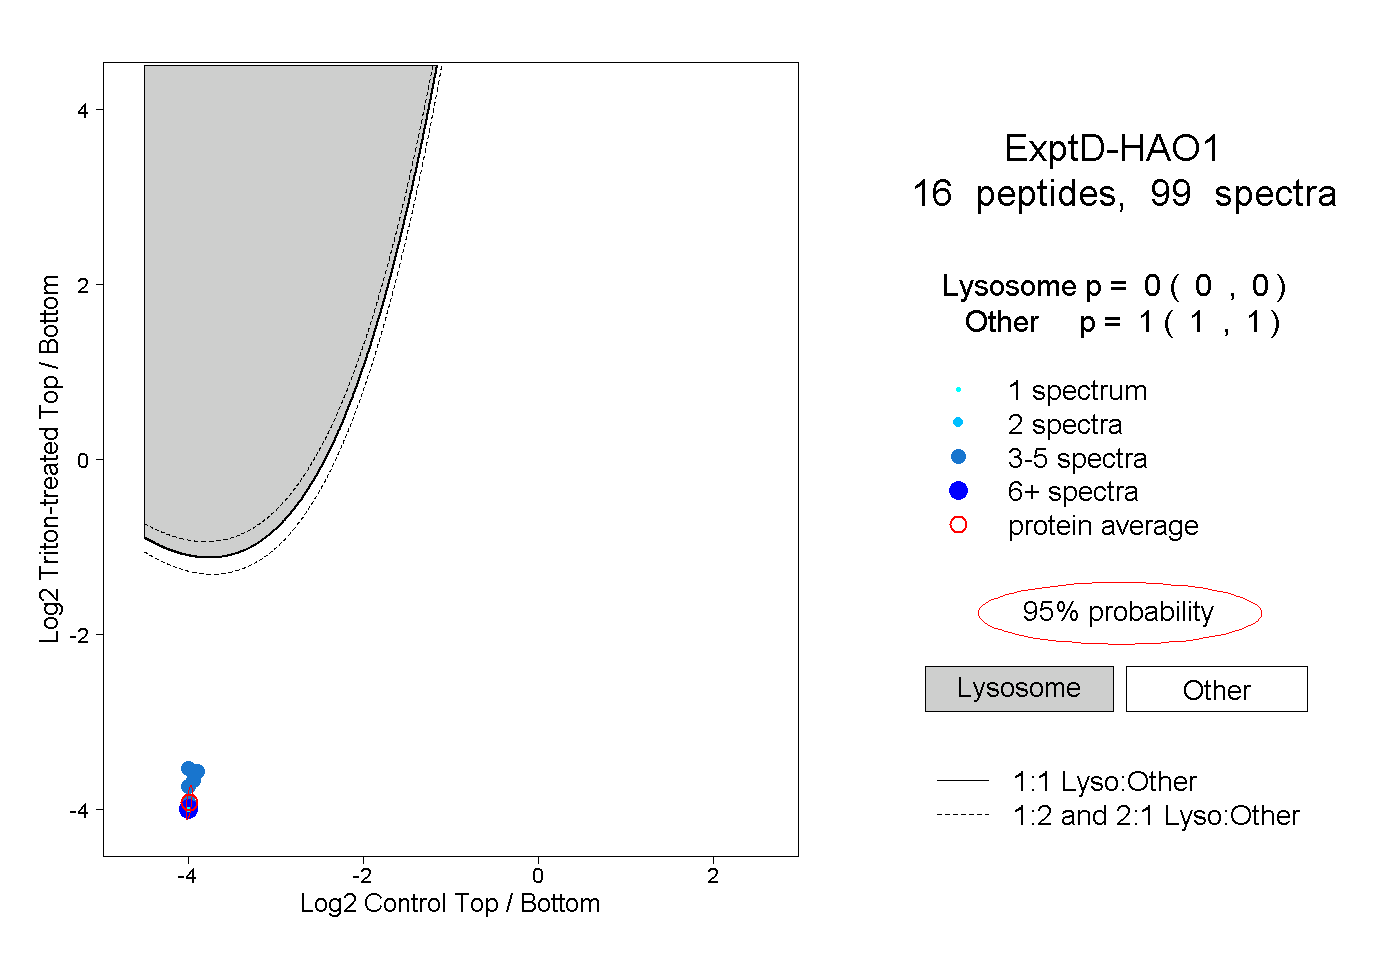
0.000 | 0.000
1.000 | 1.000