 2
2peptides
spectra

0.688 | 0.752
0.000 | 0.023
0.000 | 0.000
0.000 | 0.071
0.000 | 0.000
0.159 | 0.302
0.000 | 0.000
0.000 | 0.000
4peptides
spectra
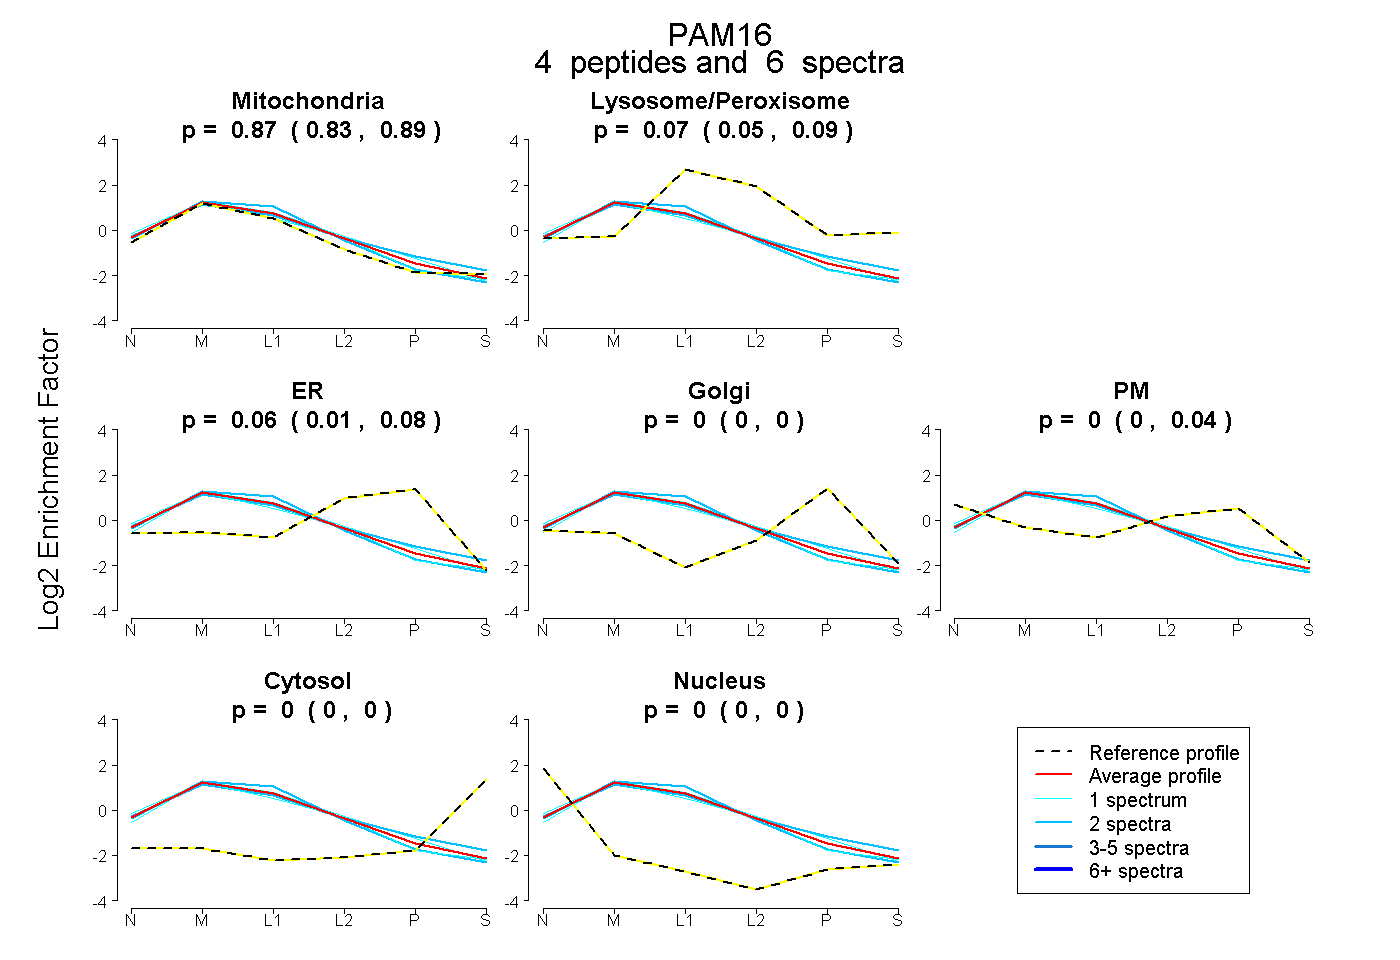
0.833 | 0.886
0.050 | 0.091
0.009 | 0.084
0.000 | 0.000
0.000 | 0.044
0.000 | 0.000
0.000 | 0.000
5peptides
spectra
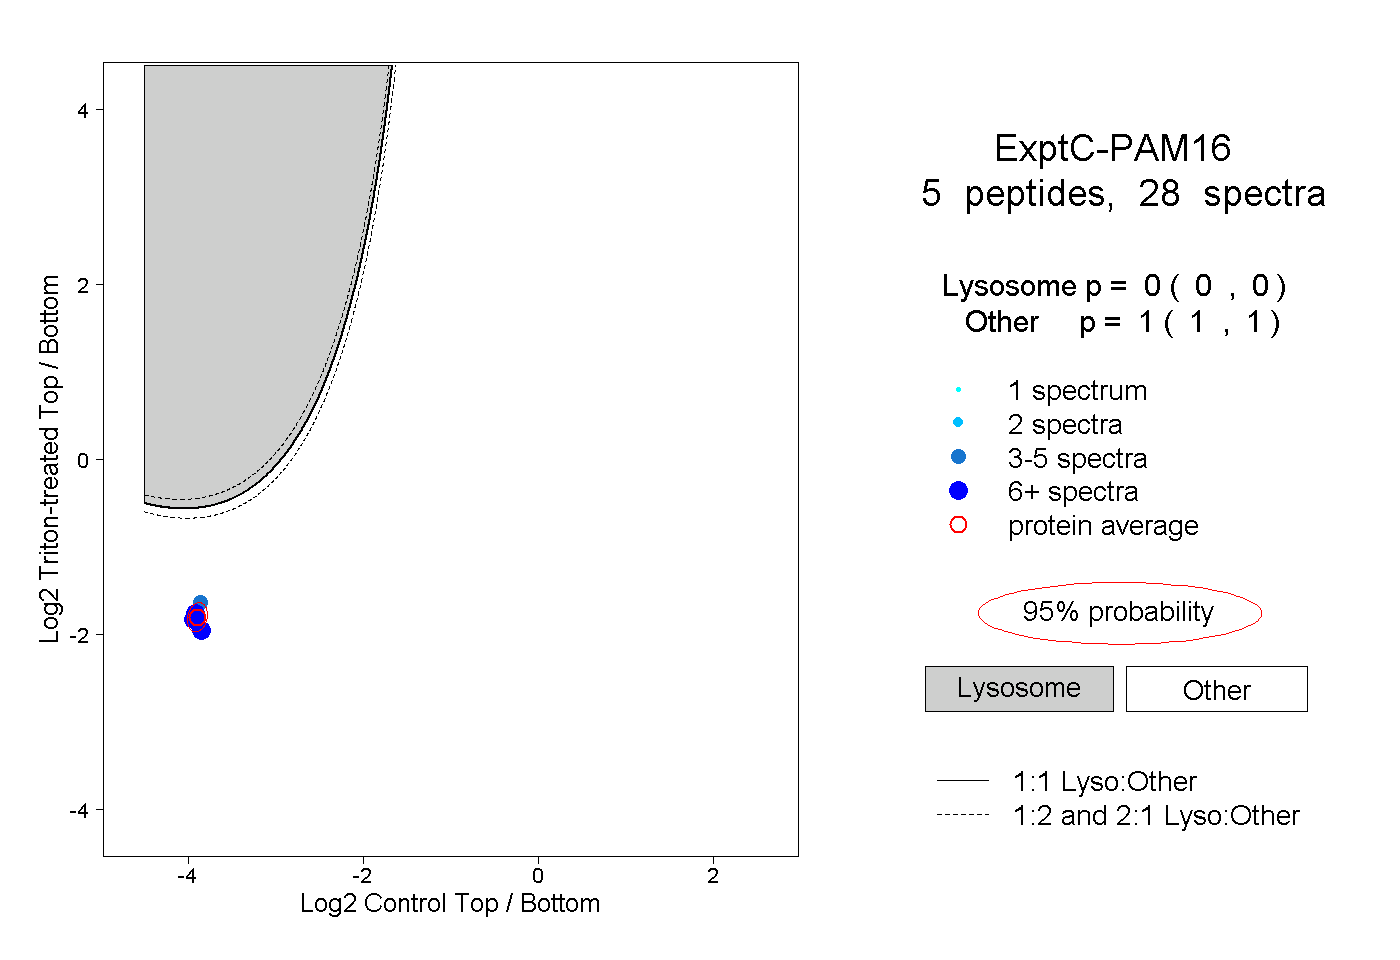
0.000 | 0.000
1.000 | 1.000
3peptides
spectra
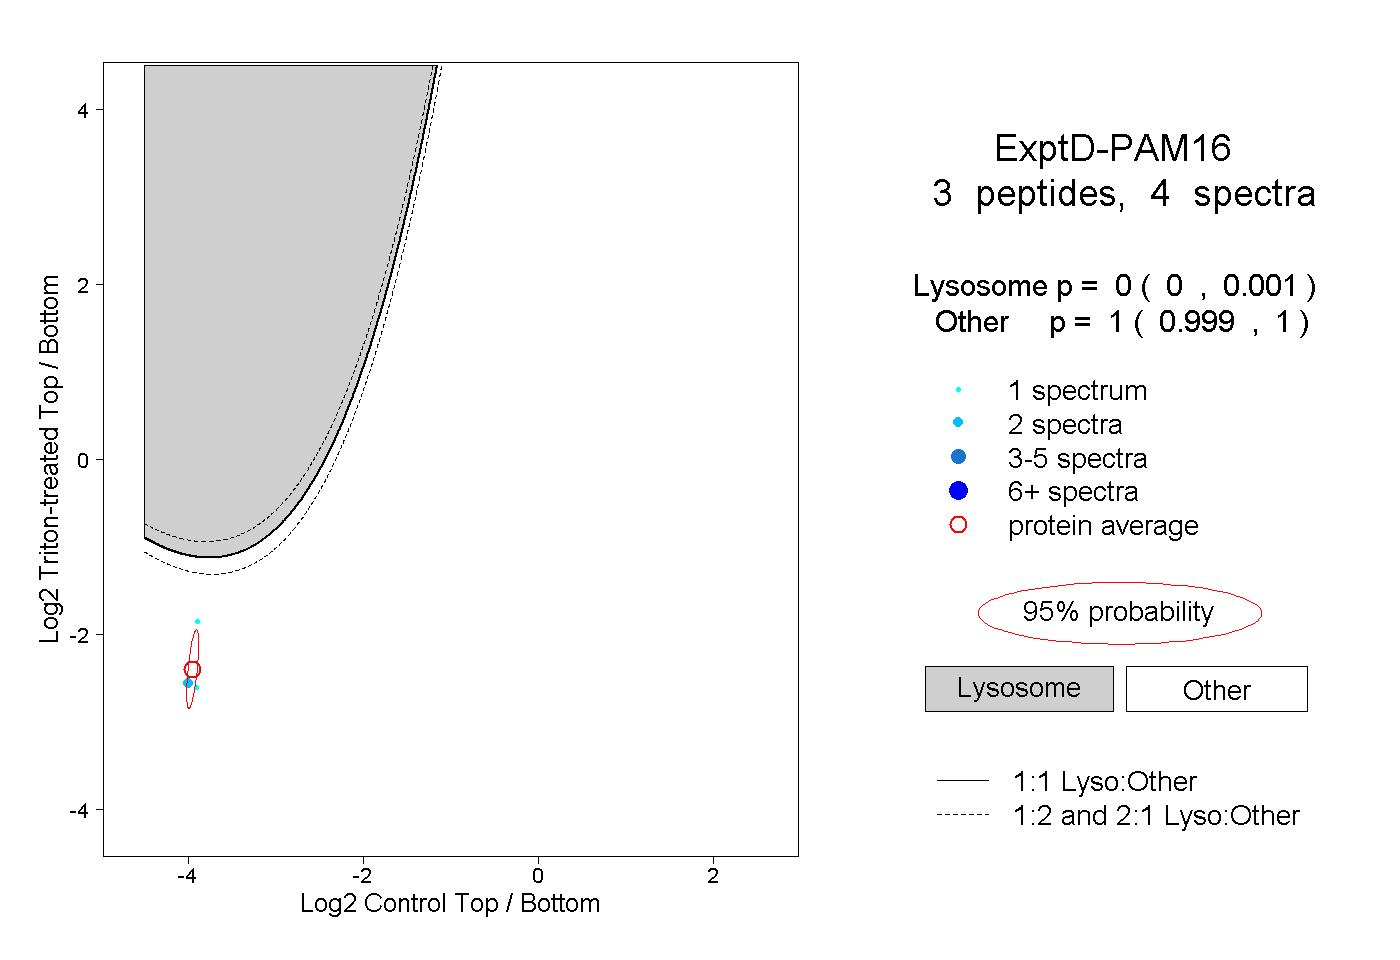
0.000 | 0.001
0.999 | 1.000