14
14peptides
spectra
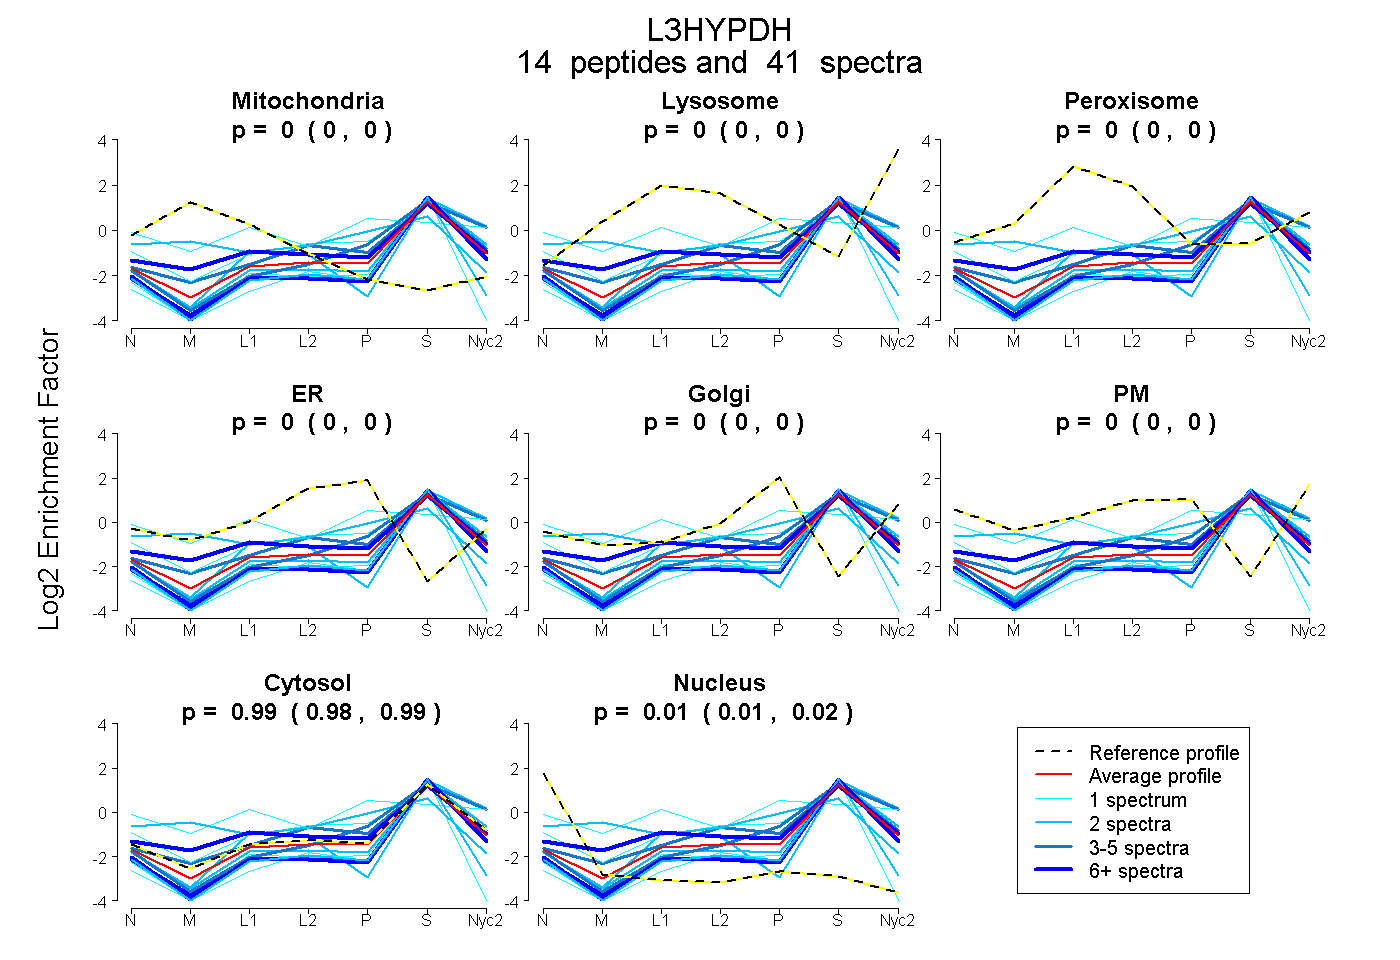
0.000 | 0.000
0.000 | 0.000
0.000 | 0.000
0.000 | 0.000
0.000 | 0.000
0.000 | 0.000
0.979 | 0.994
0.005 | 0.019
6peptides
spectra
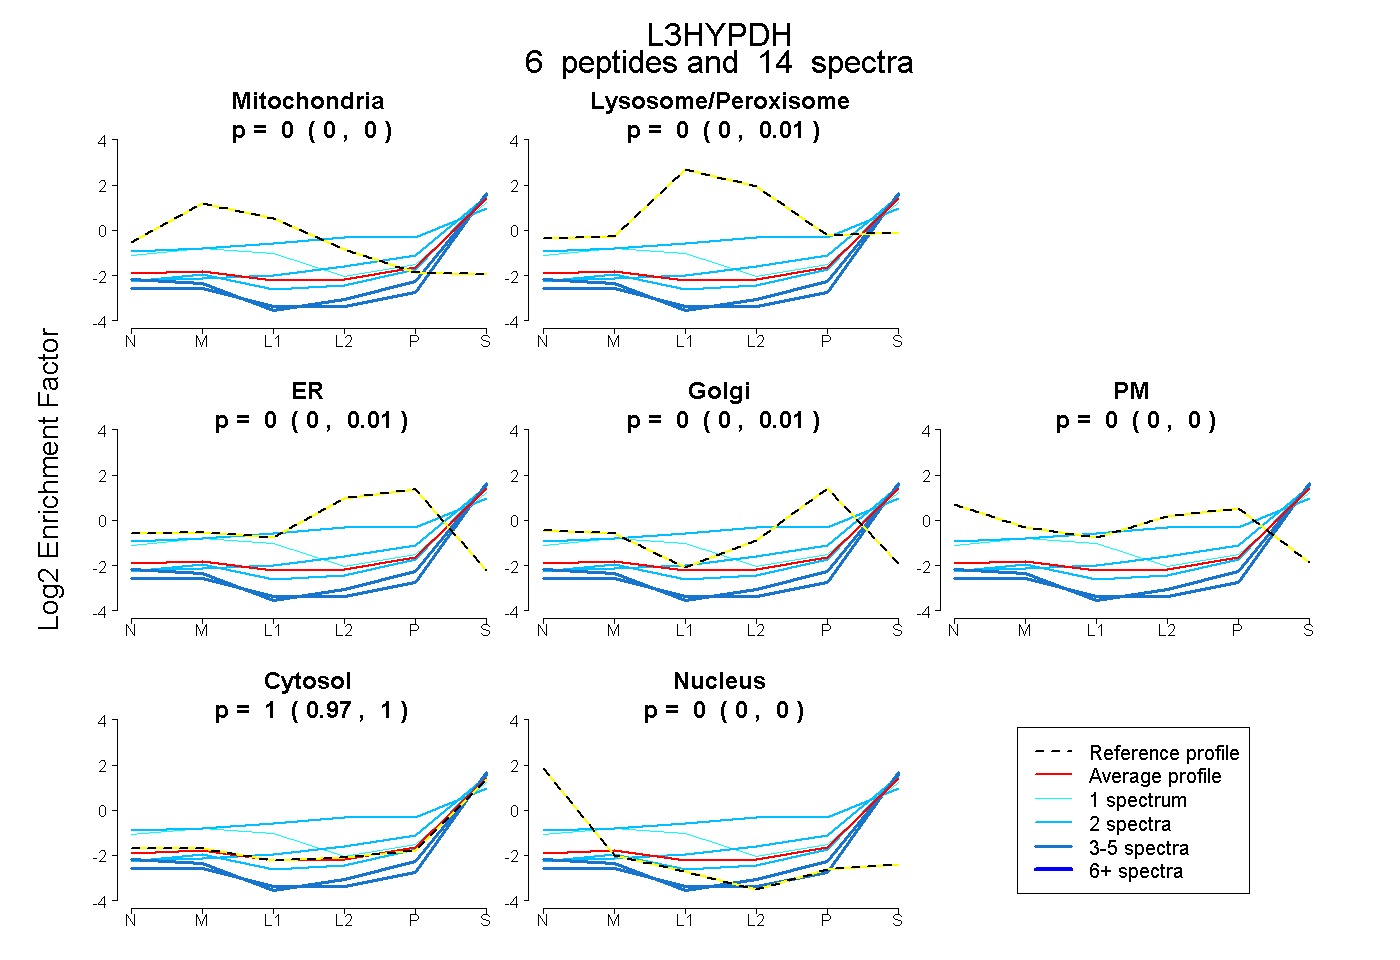
0.000 | 0.000
0.000 | 0.015
0.000 | 0.006
0.000 | 0.012
0.000 | 0.000
0.973 | 1.000
0.000 | 0.000
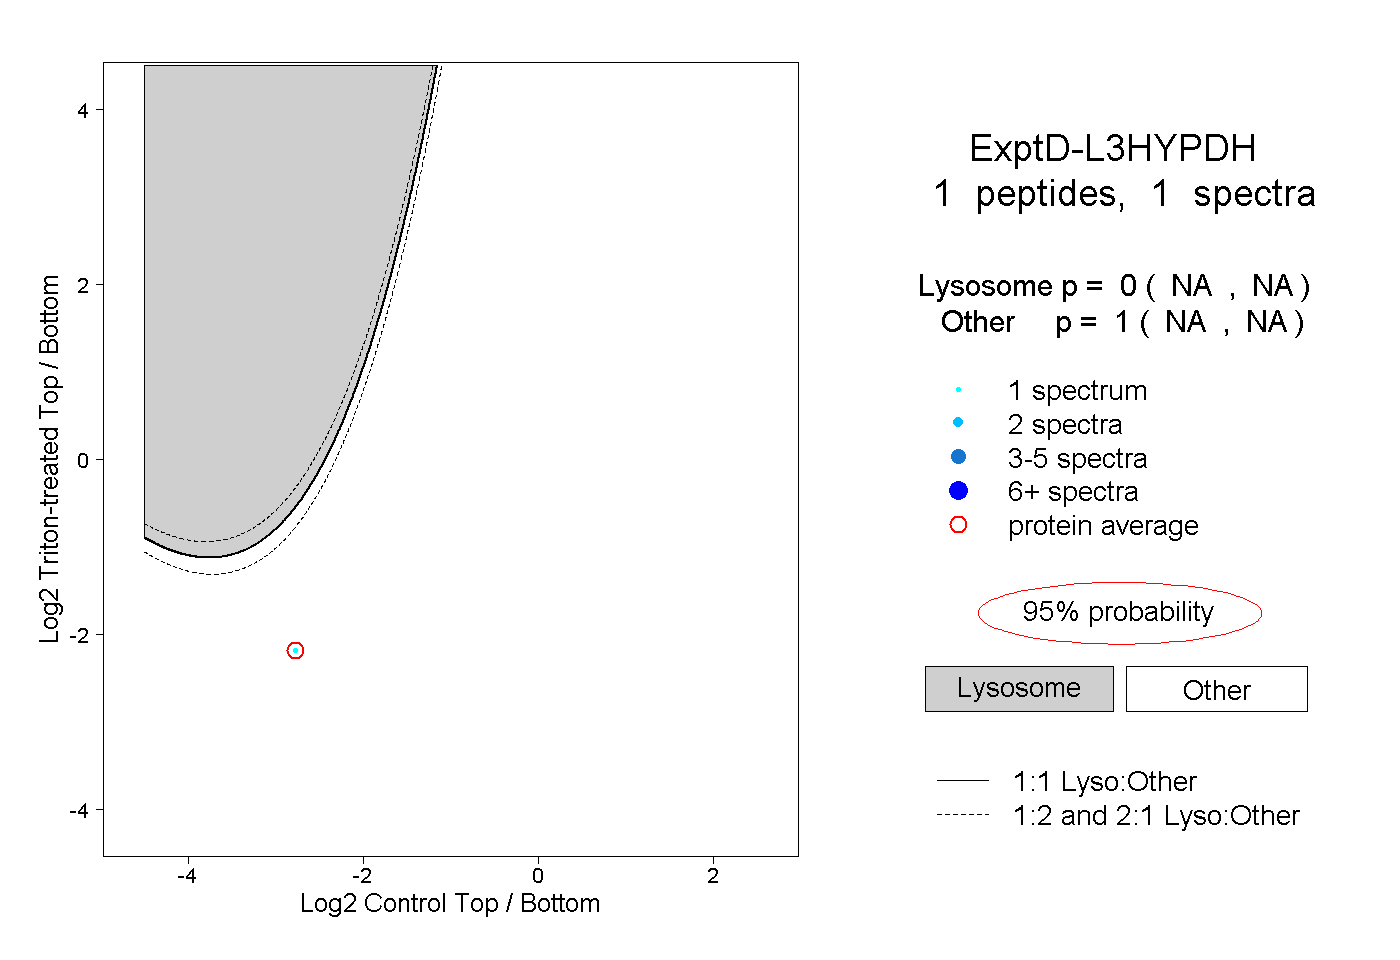
11peptides
spectra
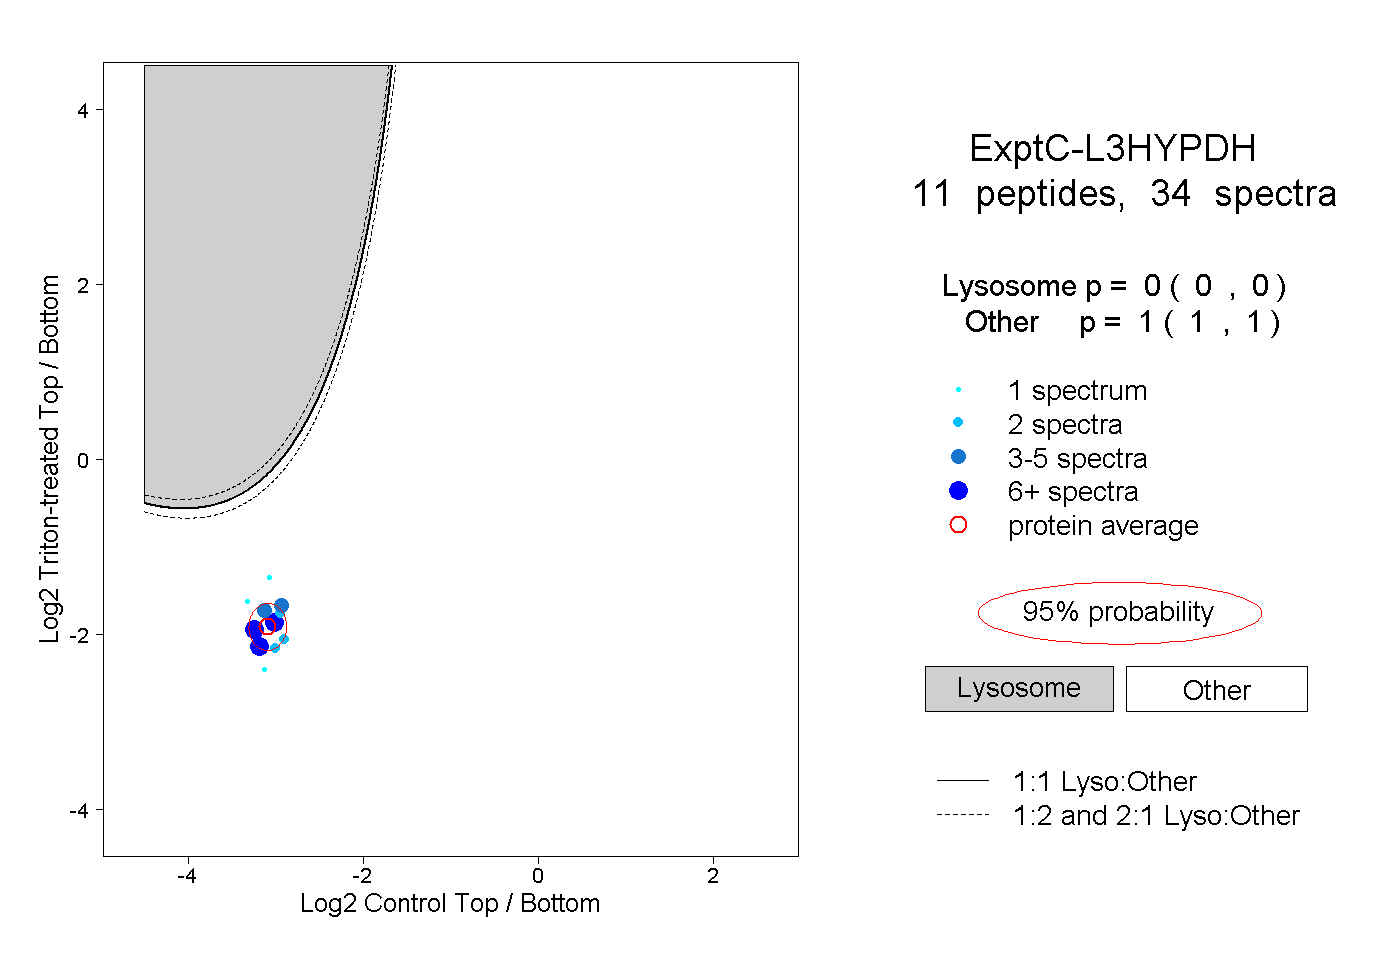
0.000 | 0.000
1.000 | 1.000