 14
14peptides
spectra
0.000 | 0.000
0.000 | 0.000
0.000 | 0.000
0.000 | 0.000
0.000 | 0.000
0.000 | 0.000
0.979 | 0.994
0.005 | 0.019
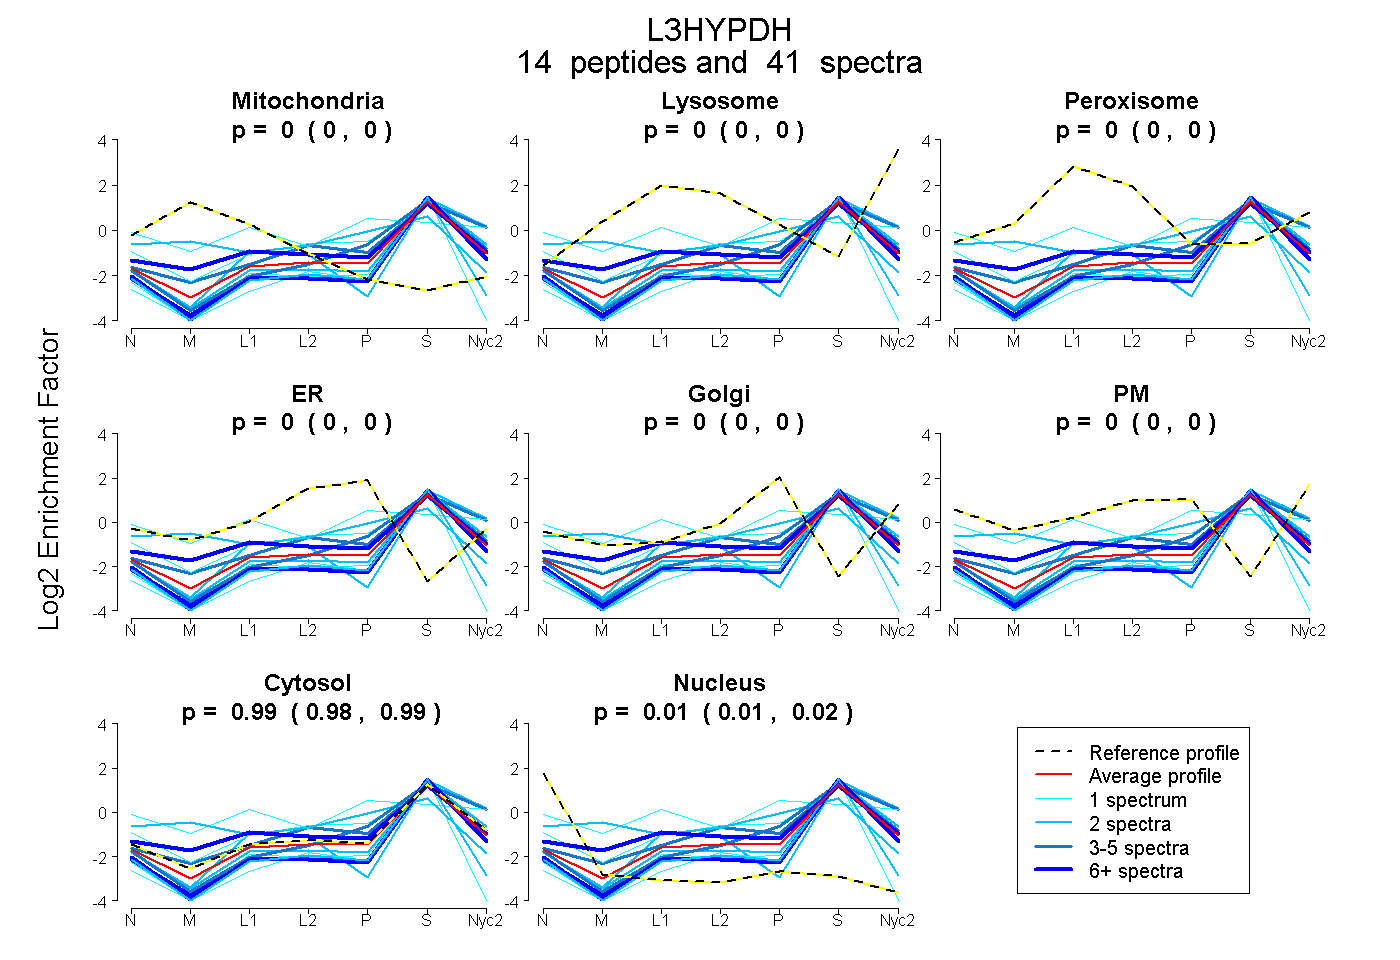
| Plot | Mito | Lyso | Perox | ER | Golgi | PM | Cytosol | Nucleus | |||||
| Expt A |
14 peptides |
41 spectra |
|
0.000 0.000 | 0.000 |
0.000 0.000 | 0.000 |
0.000 0.000 | 0.000 |
0.000 0.000 | 0.000 |
0.000 0.000 | 0.000 |
0.000 0.000 | 0.000 |
0.987 0.979 | 0.994 |
0.013 0.005 | 0.019 |
| 6 spectra, GLLQLNQTR | 0.000 | 0.000 | 0.000 | 0.000 | 0.000 | 0.000 | 0.970 | 0.030 | ||
| 1 spectrum, FALDFGLVPAPPEGTR | 0.000 | 0.000 | 0.000 | 0.000 | 0.000 | 0.000 | 0.999 | 0.001 | ||
| 2 spectra, QHLDYVR | 0.213 | 0.000 | 0.000 | 0.200 | 0.000 | 0.000 | 0.587 | 0.000 | ||
| 2 spectra, LVFEPR | 0.000 | 0.000 | 0.000 | 0.000 | 0.000 | 0.000 | 1.000 | 0.000 | ||
| 4 spectra, SCGPVR | 0.000 | 0.000 | 0.000 | 0.000 | 0.000 | 0.000 | 1.000 | 0.000 | ||
| 1 spectrum, LGLDVCSAK | 0.000 | 0.000 | 0.250 | 0.000 | 0.306 | 0.021 | 0.424 | 0.000 | ||
| 5 spectra, IALQYHK | 0.000 | 0.127 | 0.000 | 0.000 | 0.000 | 0.000 | 0.873 | 0.000 | ||
| 1 spectrum, LPPHDPR | 0.000 | 0.000 | 0.038 | 0.144 | 0.000 | 0.000 | 0.818 | 0.000 | ||
| 1 spectrum, EAQVNIHCPCGLVTAFVECEGGR | 0.000 | 0.000 | 0.000 | 0.000 | 0.000 | 0.000 | 0.778 | 0.222 | ||
| 2 spectra, SSATGSVFTGCAVR | 0.000 | 0.000 | 0.000 | 0.000 | 0.000 | 0.000 | 0.850 | 0.150 | ||
| 1 spectrum, DGFLLK | 0.000 | 0.000 | 0.000 | 0.000 | 0.000 | 0.000 | 1.000 | 0.000 | ||
| 6 spectra, SPTGSGVTAR | 0.000 | 0.000 | 0.000 | 0.000 | 0.000 | 0.000 | 0.938 | 0.062 | ||
| 7 spectra, TPALSVVDMHTGGEPLR | 0.063 | 0.000 | 0.086 | 0.000 | 0.000 | 0.000 | 0.851 | 0.000 | ||
| 2 spectra, DLVNAASALTGAVK | 0.000 | 0.020 | 0.000 | 0.000 | 0.000 | 0.000 | 0.980 | 0.000 |
| Plot | Mito | Lyso or Perox | ER | Golgi | PM | Cytosol | Nucleus | ||||||
| Expt B |
6 peptides |
14 spectra |
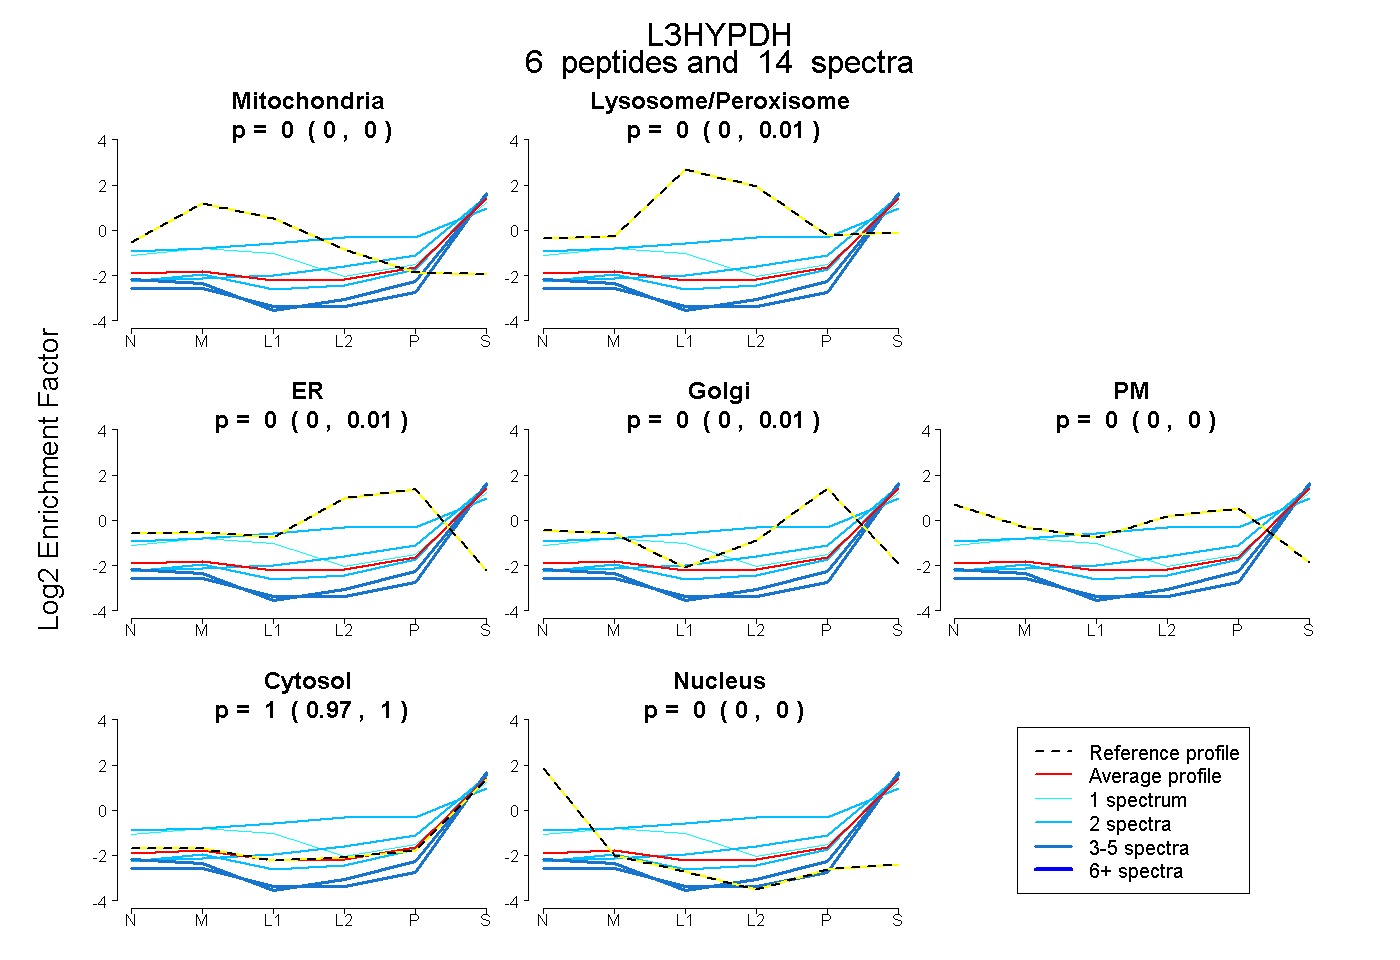 |
0.000 0.000 | 0.000 |
0.000 0.000 | 0.015 |
0.000 0.000 | 0.006 |
0.000 0.000 | 0.012 |
0.000 0.000 | 0.000 |
1.000 0.973 | 1.000 |
0.000 0.000 | 0.000 |
|||
| Plot | Lyso | Other | |||||||||||
| Expt C |
11 peptides |
34 spectra |
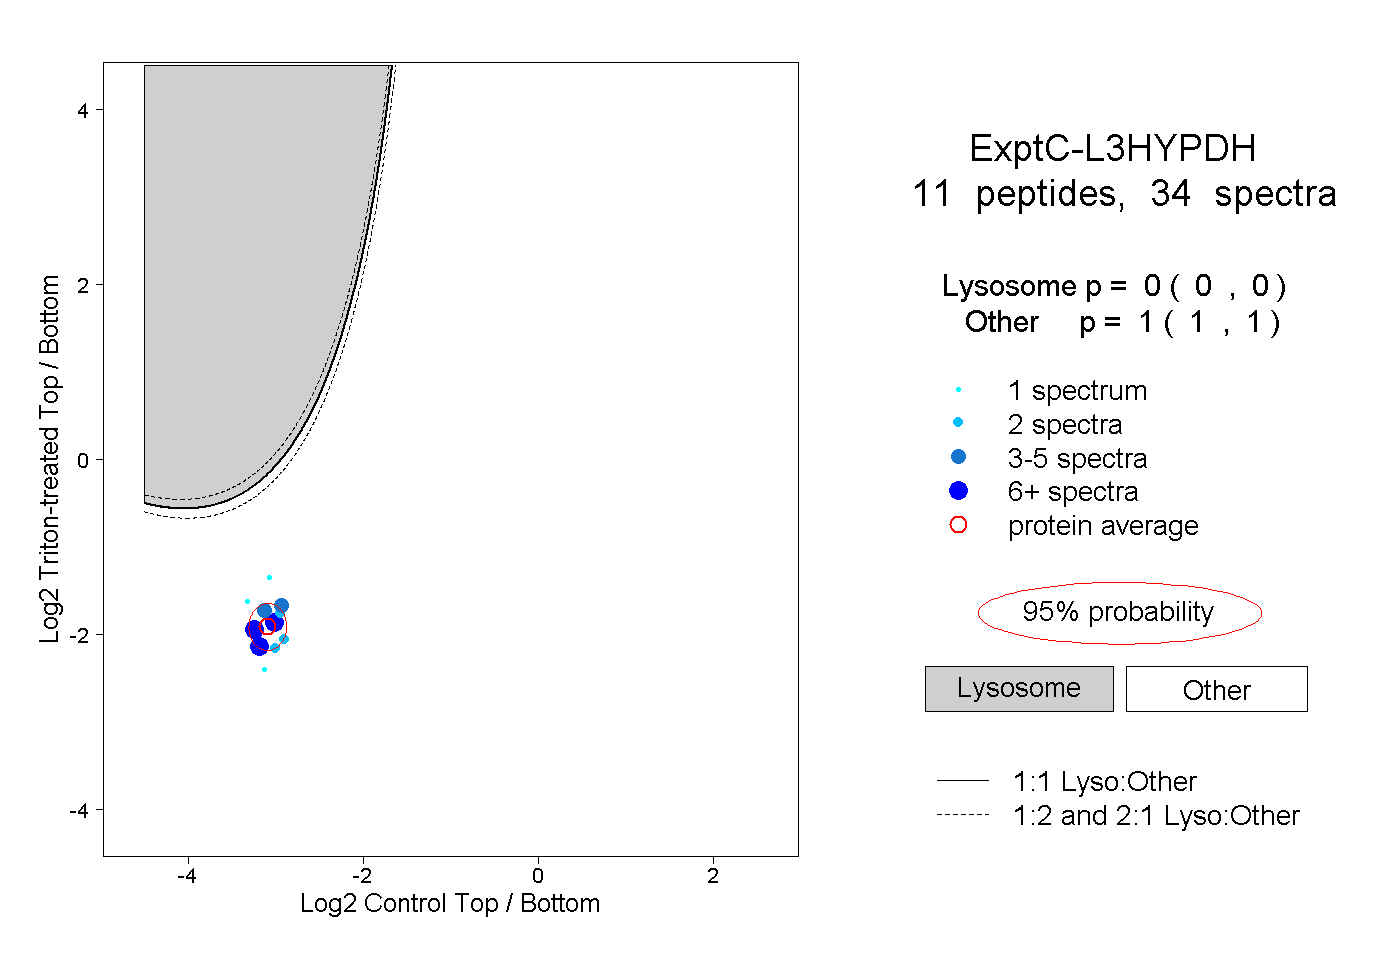 |
0.000 0.000 | 0.000 |
1.000 1.000 | 1.000 |
||||||||
| Plot | Lyso | Other | |||||||||||
| Expt D |
1 peptide |
1 spectrum |
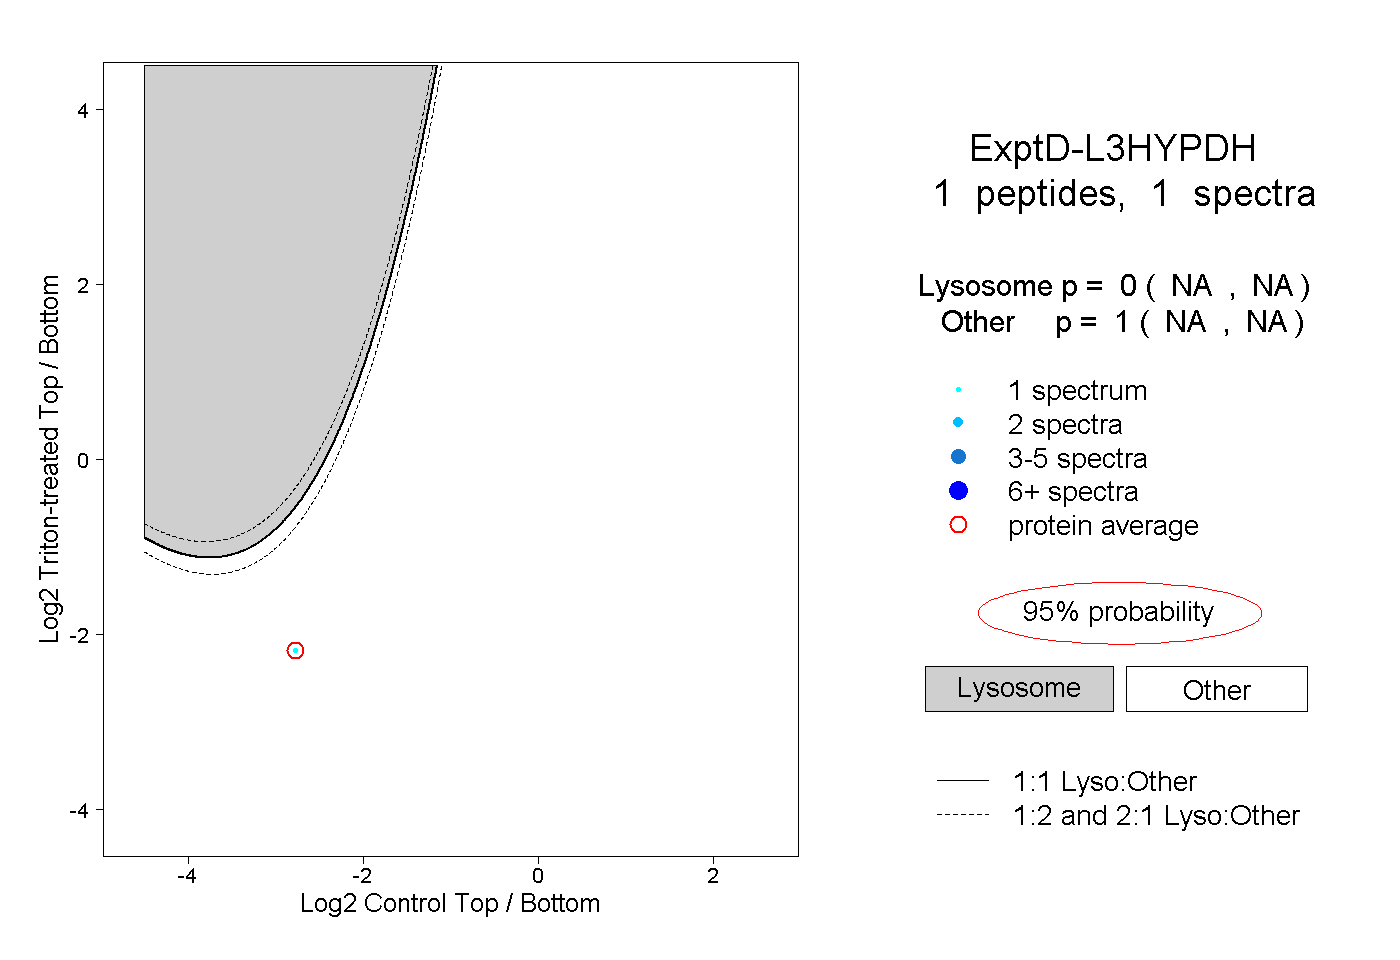 |
0.000 NA | NA |
1.000 NA | NA |