 1
1peptide
spectra
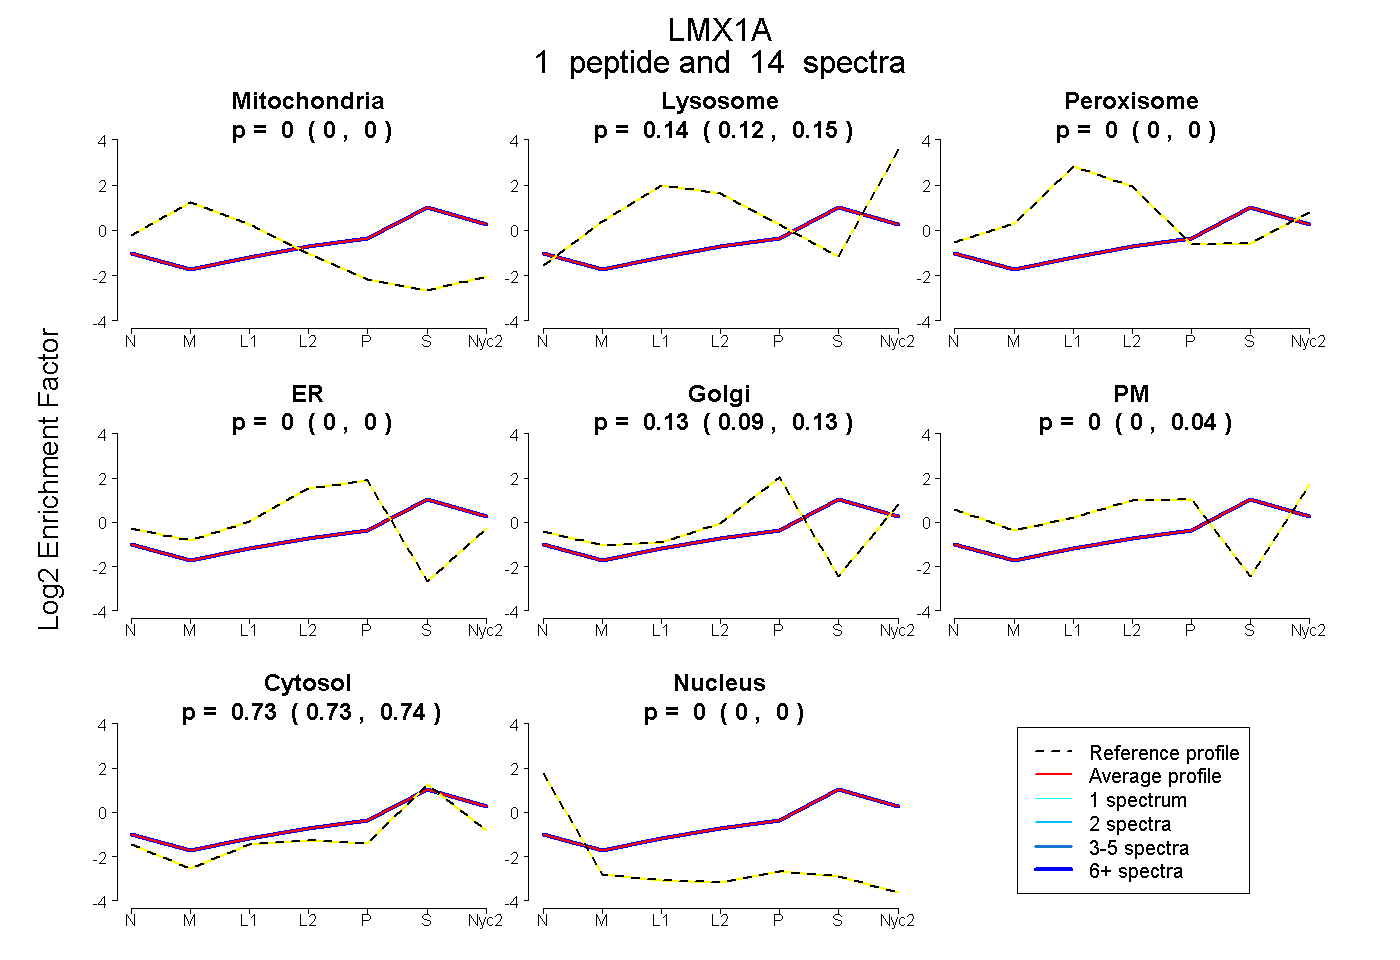
0.000 | 0.000
0.117 | 0.147
0.000 | 0.000
0.000 | 0.000
0.090 | 0.133
0.000 | 0.043
0.727 | 0.742
0.000 | 0.000
1peptide
spectra
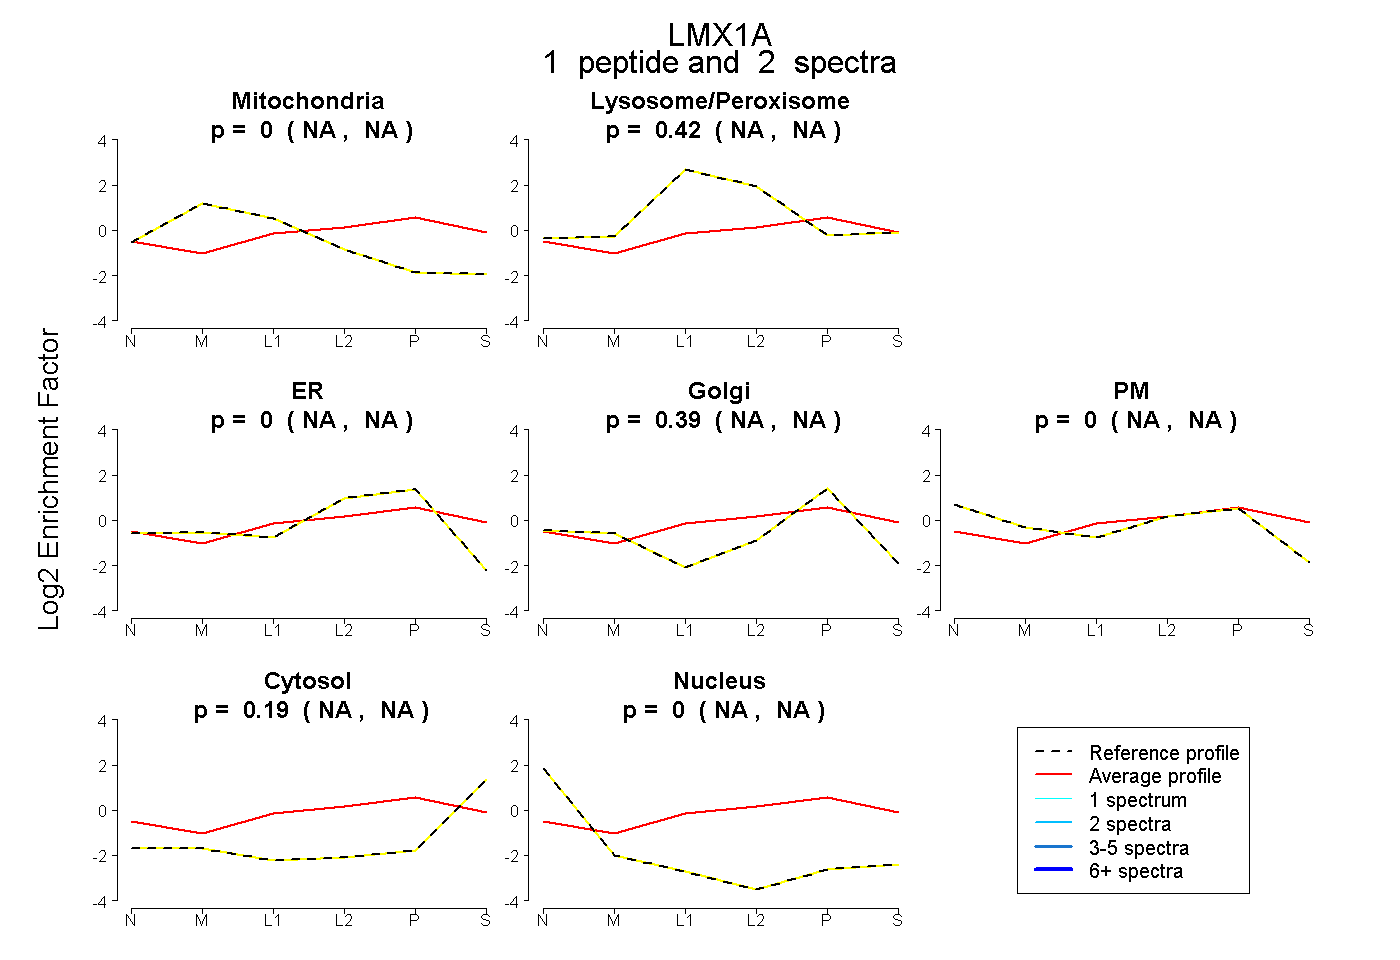
NA | NA
NA | NA
NA | NA
NA | NA
NA | NA
NA | NA
NA | NA
1peptide
spectra
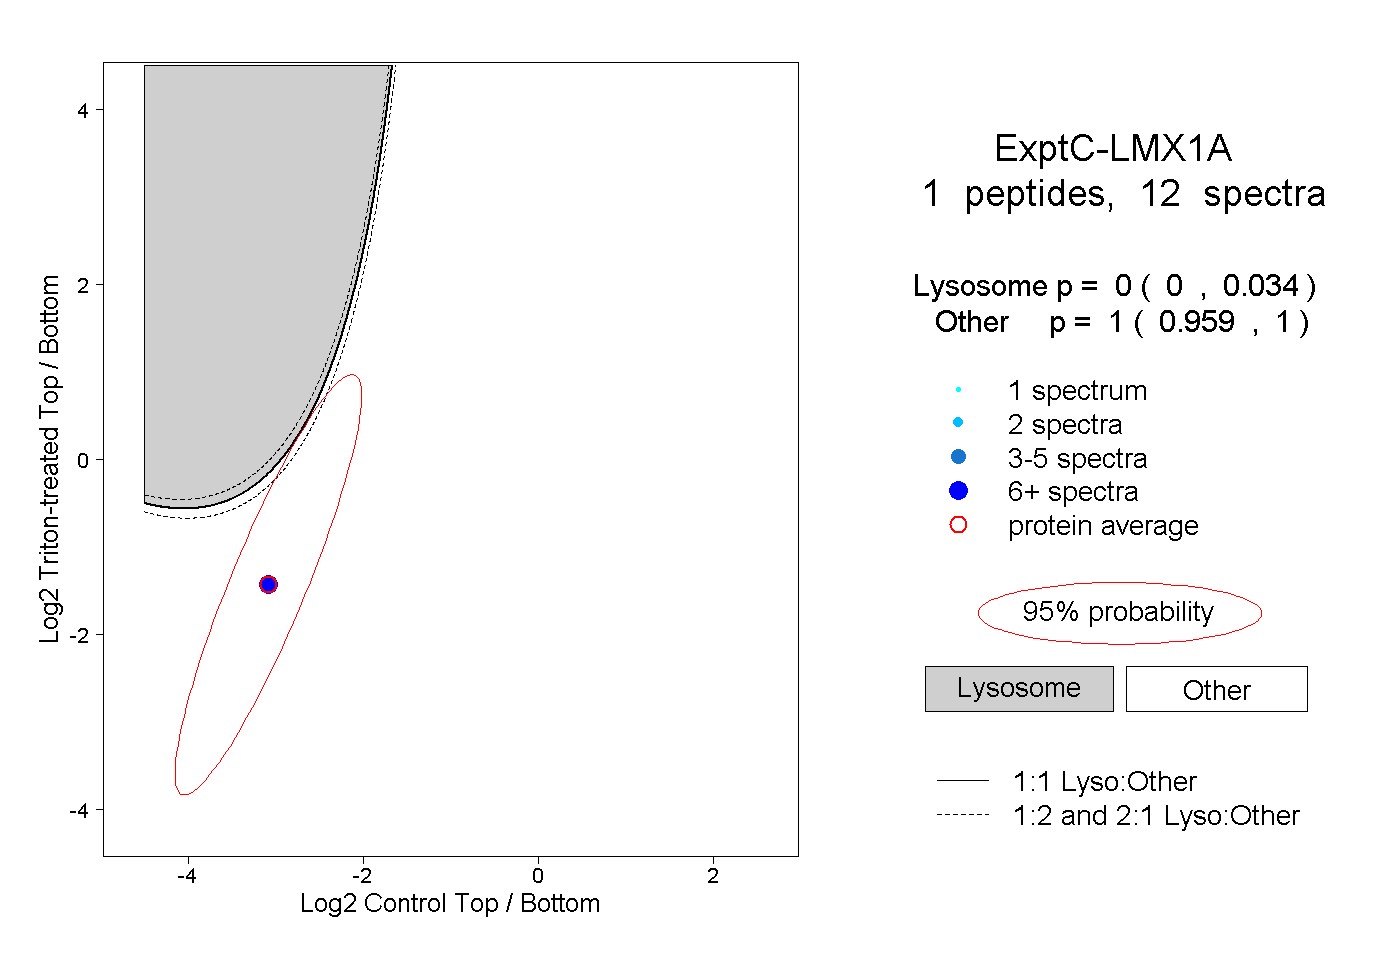
0.000 | 0.034
0.959 | 1.000
1peptide
spectra
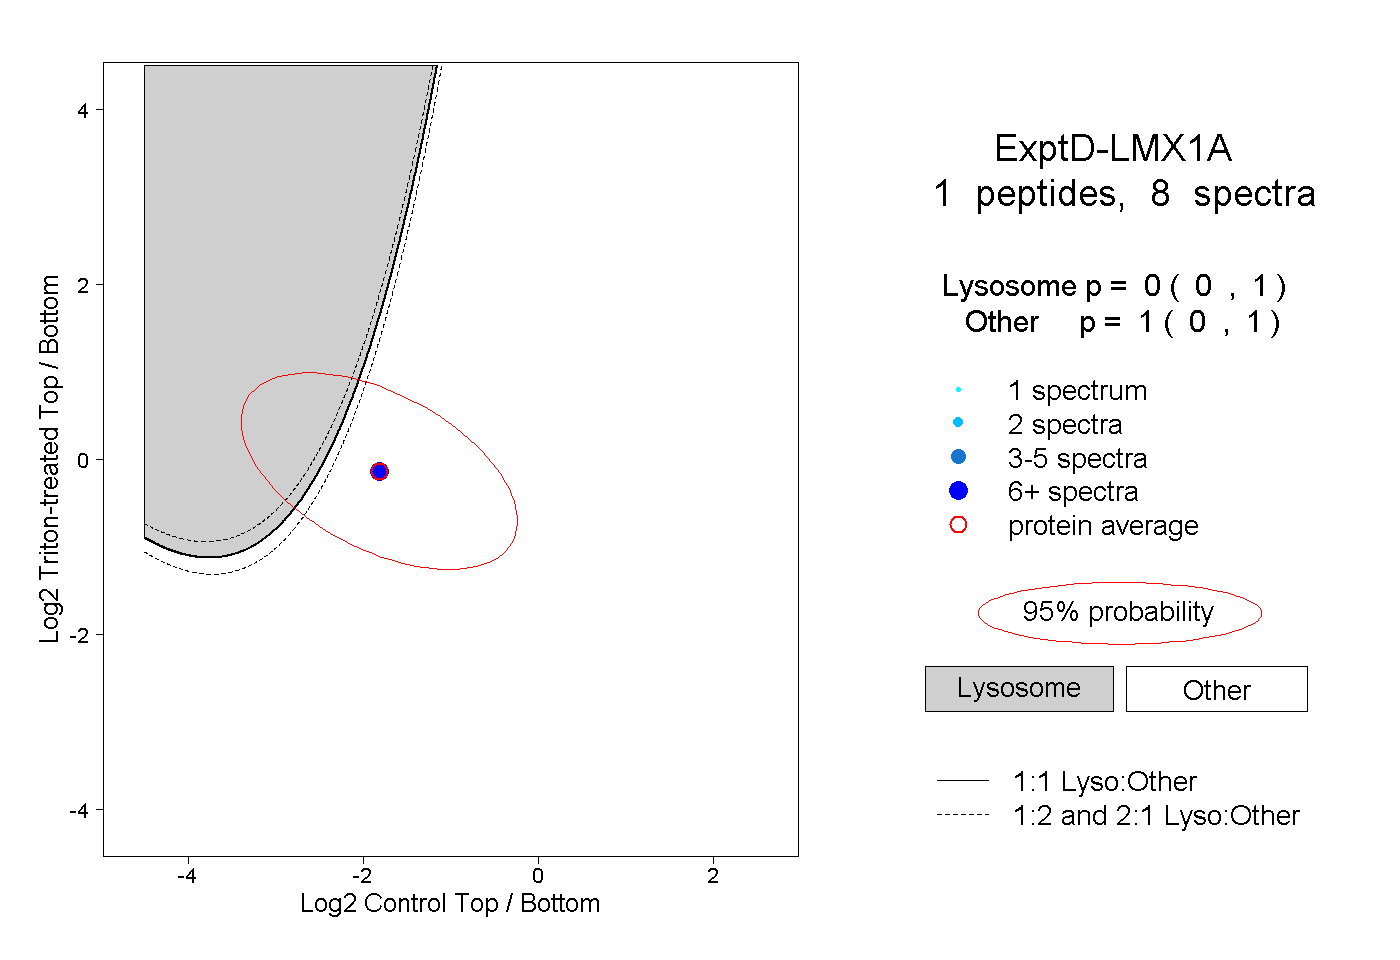
0.000 | 1.000
0.000 | 1.000