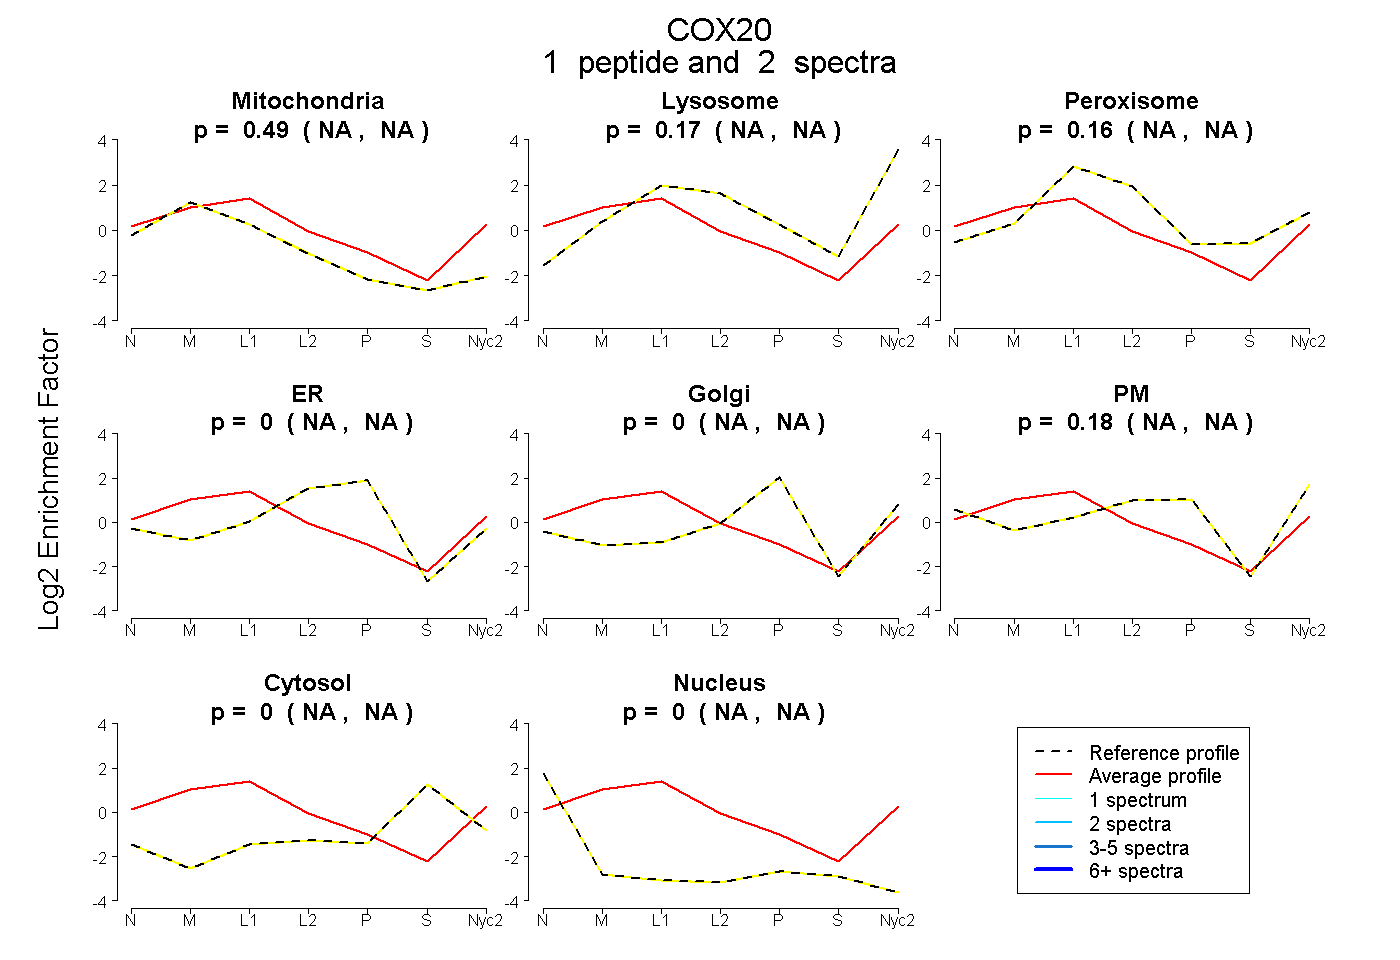
 1
1peptide
spectra
NA | NA
NA | NA
NA | NA
NA | NA
NA | NA
NA | NA
NA | NA
NA | NA
| Plot | Mito | Lyso | Perox | ER | Golgi | PM | Cytosol | Nucleus | |||||
| Expt A |
1 peptide |
2 spectra |
|
0.493 NA | NA |
0.166 NA | NA |
0.165 NA | NA |
0.000 NA | NA |
0.000 NA | NA |
0.176 NA | NA |
0.000 NA | NA |
0.000 NA | NA |
| 2 spectra, LLGILDVENTPCAR | 0.493 | 0.166 | 0.165 | 0.000 | 0.000 | 0.176 | 0.000 | 0.000 |
| Plot | Lyso | Other | |||||||||||
| Expt C |
2 peptides |
6 spectra |
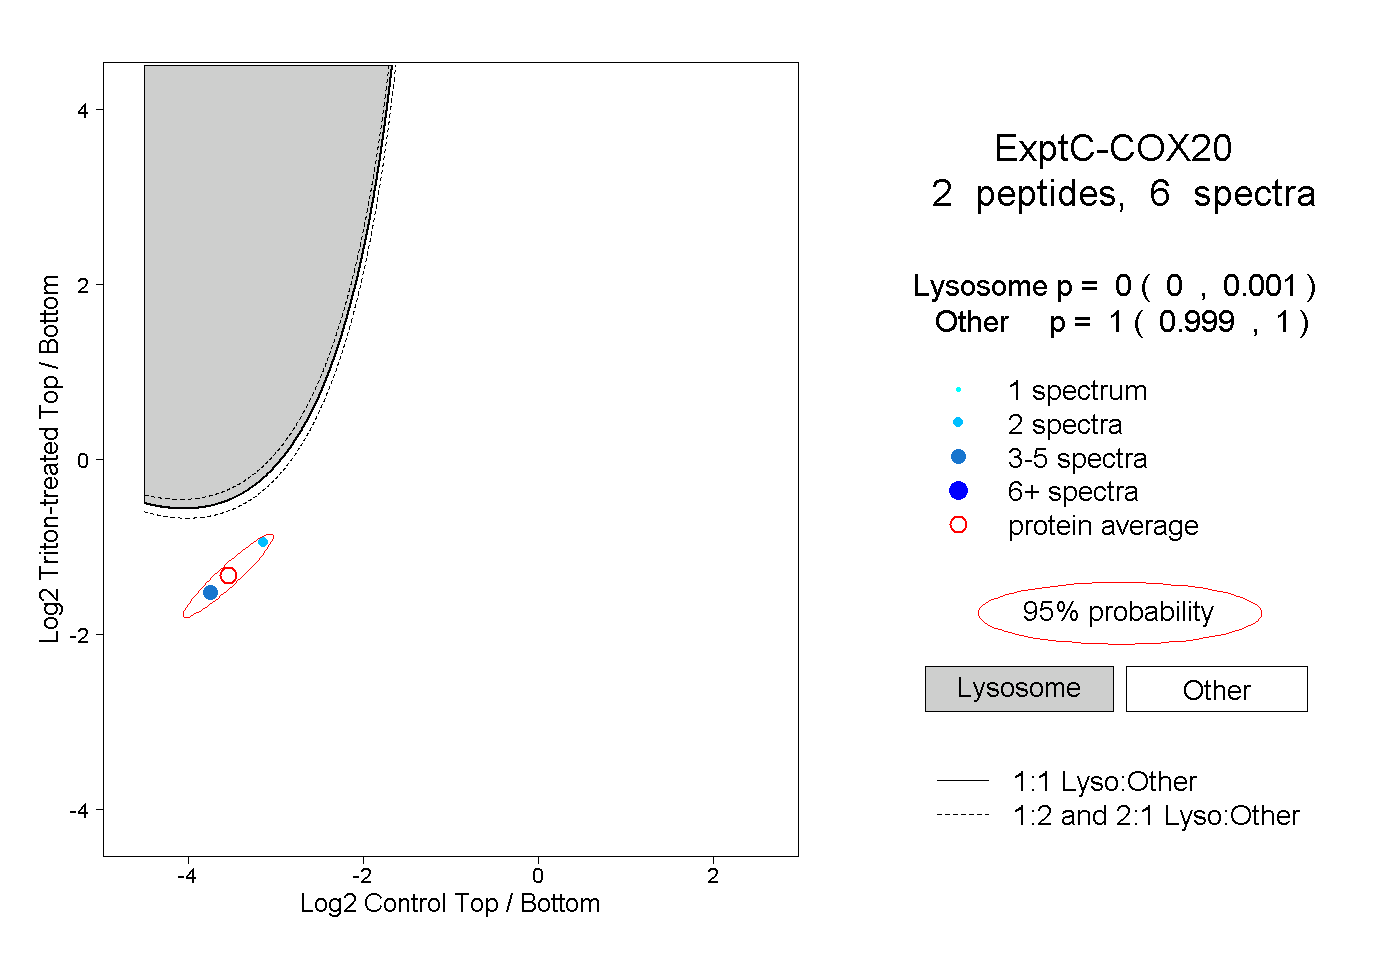 |
0.000 0.000 | 0.001 |
1.000 0.999 | 1.000 |