 2
2peptides
spectra
0.000 | 0.000
0.048 | 0.101
0.000 | 0.000
0.000 | 0.000
0.000 | 0.000
0.387 | 0.454
0.484 | 0.513
0.000 | 0.000
1peptide
spectra
0.000 | 0.000
1.000 | 1.000
| Plot | Mito | Lyso | Perox | ER | Golgi | PM | Cytosol | Nucleus | |||||
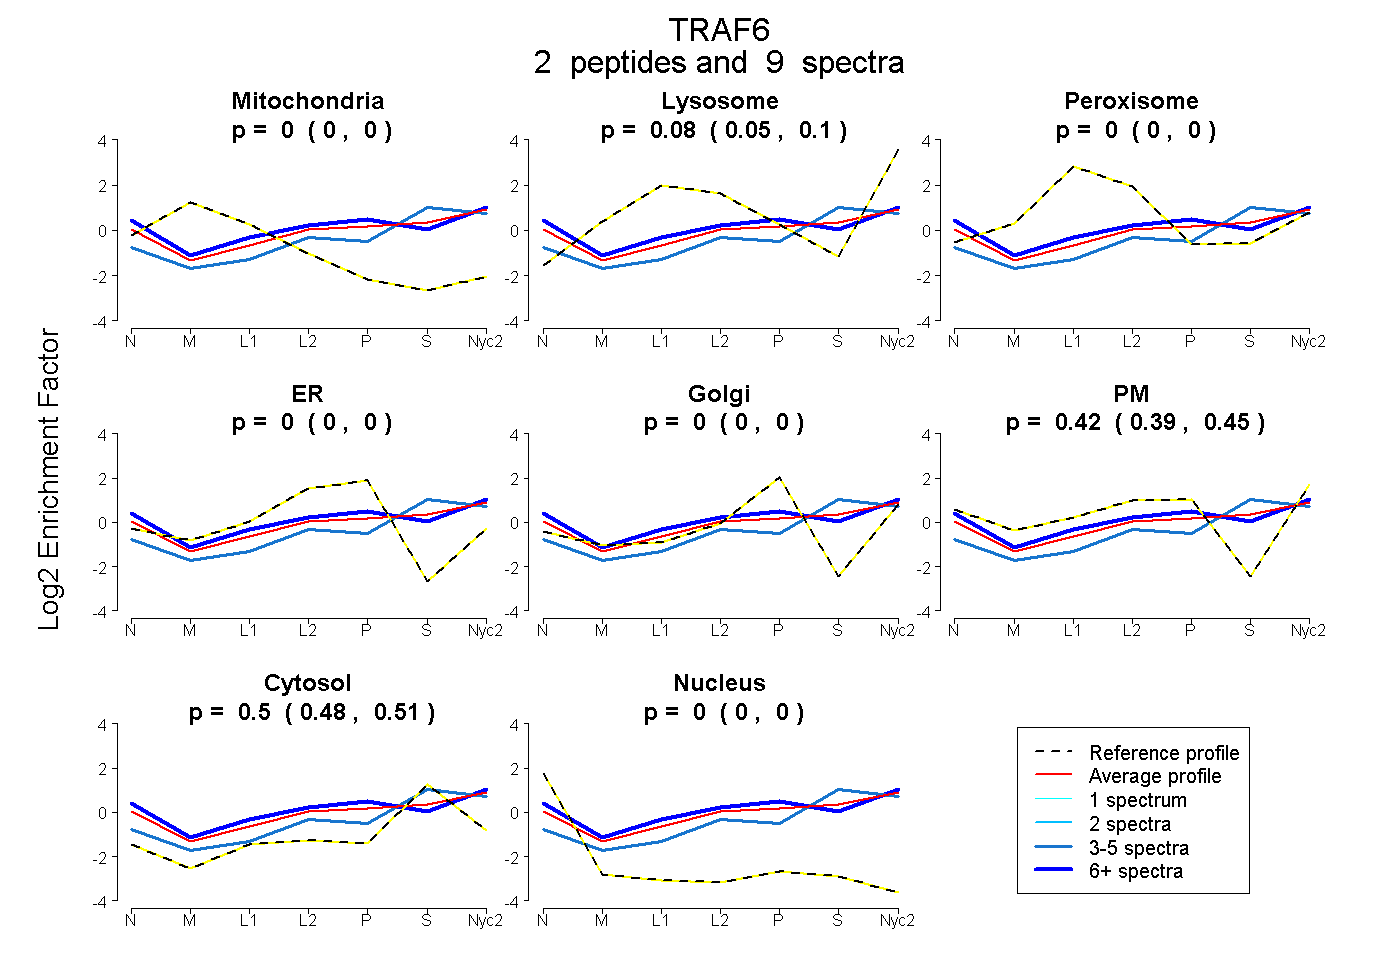
| Expt A |
2 peptides |
9 spectra |
|
0.000 0.000 | 0.000 |
0.078 0.048 | 0.101 |
0.000 0.000 | 0.000 |
0.000 0.000 | 0.000 |
0.000 0.000 | 0.000 |
0.422 0.387 | 0.454 |
0.500 0.484 | 0.513 |
0.000 0.000 | 0.000 |
||
| Plot | Lyso | Other | |||||||||||
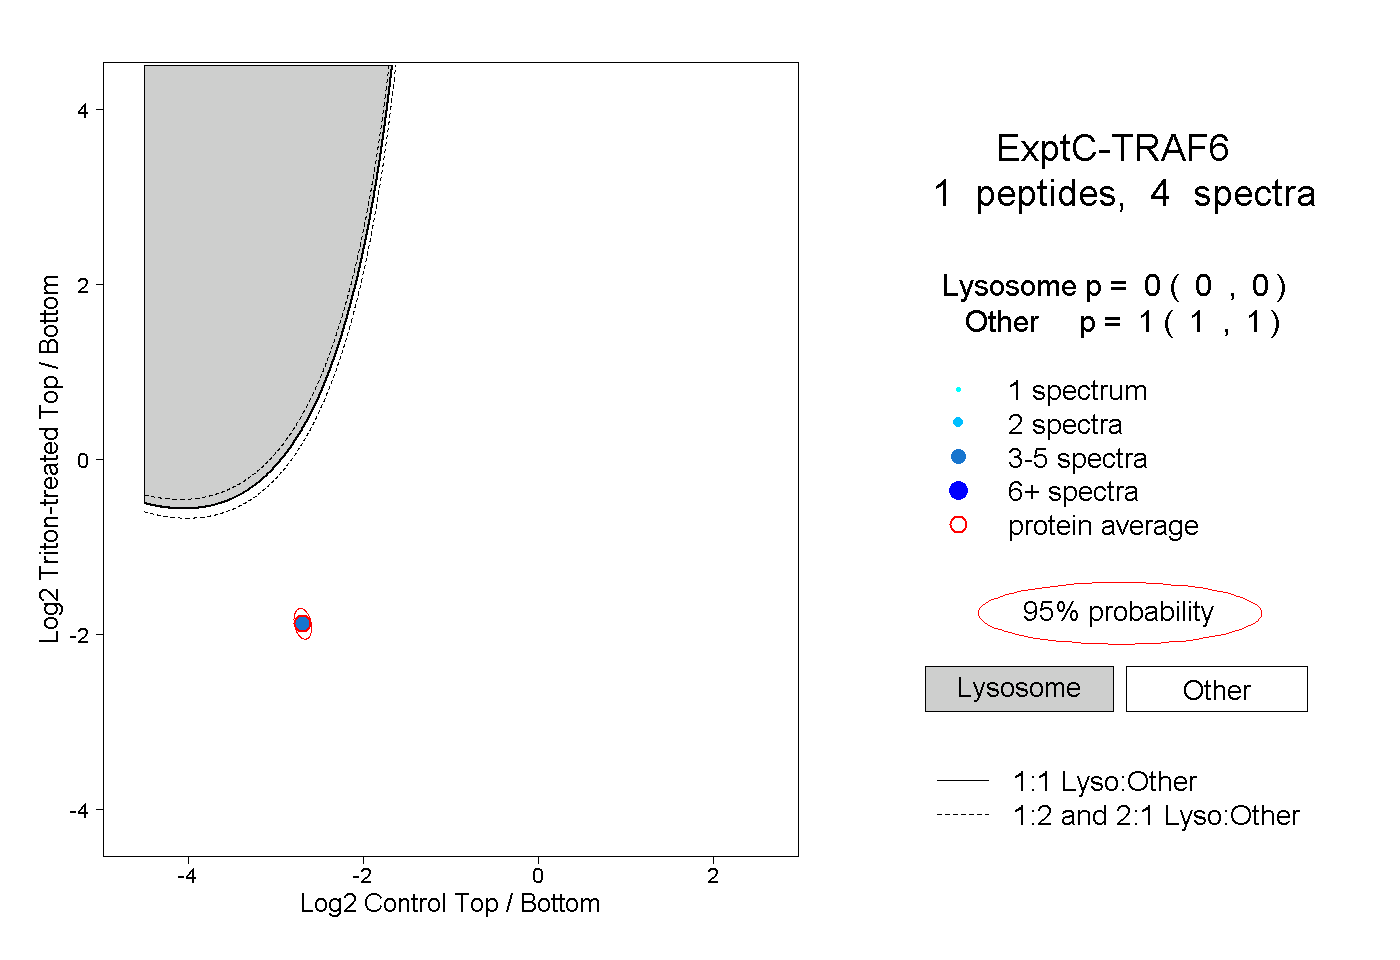
| Expt C |
1 peptide |
4 spectra |
|
0.000 0.000 | 0.000 |
1.000 1.000 | 1.000 |