 11
11peptides
spectra
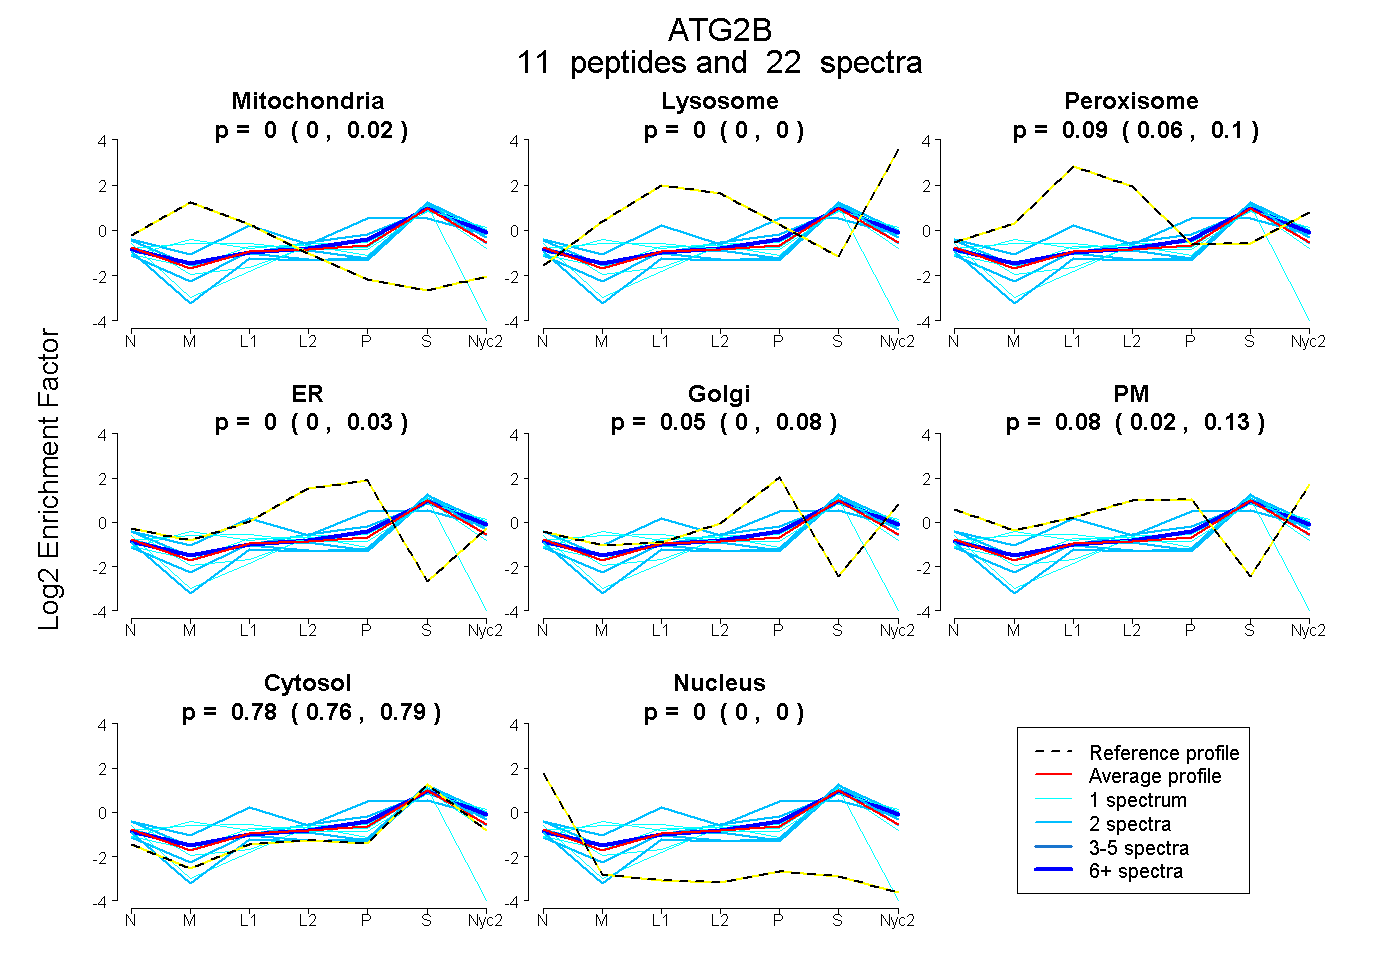
0.000 | 0.018
0.000 | 0.000
0.061 | 0.104
0.000 | 0.029
0.000 | 0.083
0.021 | 0.135
0.760 | 0.791
0.000 | 0.000
| Plot | Mito | Lyso | Perox | ER | Golgi | PM | Cytosol | Nucleus | |||||
| Expt A |
11 peptides |
22 spectra |
|
0.000 0.000 | 0.018 |
0.000 0.000 | 0.000 |
0.088 0.061 | 0.104 |
0.000 0.000 | 0.029 |
0.051 0.000 | 0.083 |
0.083 0.021 | 0.135 |
0.778 0.760 | 0.791 |
0.000 0.000 | 0.000 |
| 2 spectra, GPVLPEAEQQLLR | 0.091 | 0.070 | 0.008 | 0.000 | 0.000 | 0.021 | 0.810 | 0.000 | ||
| 1 spectrum, INPPAMHSILER | 0.117 | 0.230 | 0.000 | 0.000 | 0.037 | 0.000 | 0.616 | 0.000 | ||
| 2 spectra, APLHFPVPAIR | 0.000 | 0.135 | 0.000 | 0.000 | 0.000 | 0.000 | 0.865 | 0.000 | ||
| 1 spectrum, YLGHFLQEK | 0.135 | 0.220 | 0.015 | 0.000 | 0.000 | 0.000 | 0.630 | 0.000 | ||
| 1 spectrum, EGTDAHLPVCLQLHYK | 0.000 | 0.000 | 0.000 | 0.042 | 0.000 | 0.120 | 0.793 | 0.046 | ||
| 2 spectra, SPGADVTCSLPR | 0.000 | 0.000 | 0.000 | 0.000 | 0.000 | 0.020 | 0.968 | 0.012 | ||
| 2 spectra, IVYEPHPQLTR | 0.000 | 0.000 | 0.270 | 0.000 | 0.267 | 0.000 | 0.463 | 0.000 | ||
| 1 spectrum, MAIDFFSCIEK | 0.179 | 0.000 | 0.000 | 0.042 | 0.000 | 0.000 | 0.706 | 0.073 | ||
| 7 spectra, RPAPSPFSSR | 0.000 | 0.063 | 0.033 | 0.000 | 0.077 | 0.095 | 0.733 | 0.000 | ||
| 1 spectrum, NRPMQQEDEYR | 0.000 | 0.000 | 0.000 | 0.000 | 0.000 | 0.100 | 0.900 | 0.000 | ||
| 2 spectra, ELSGSFQEEK | 0.000 | 0.000 | 0.012 | 0.000 | 0.000 | 0.295 | 0.693 | 0.000 |
| Plot | Mito | Lyso or Perox | ER | Golgi | PM | Cytosol | Nucleus | ||||||
| Expt B |
3 peptides |
4 spectra |
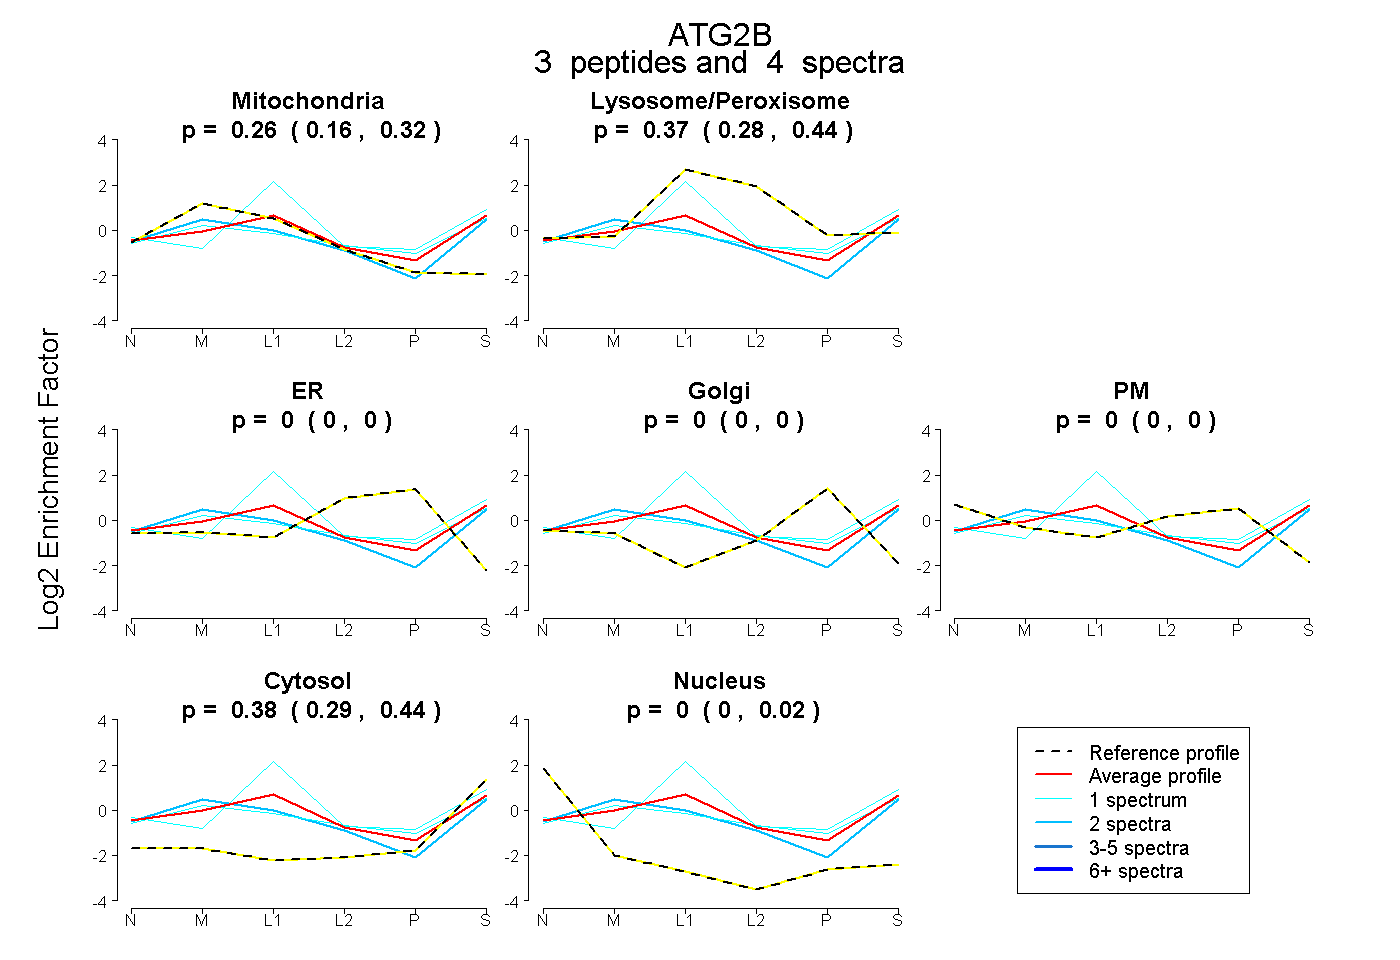 |
0.256 0.156 | 0.322 |
0.366 0.276 | 0.443 |
0.000 0.000 | 0.000 |
0.000 0.000 | 0.000 |
0.000 0.000 | 0.000 |
0.378 0.293 | 0.436 |
0.000 0.000 | 0.021 |
|||
| Plot | Lyso | Other | |||||||||||
| Expt C |
4 peptides |
6 spectra |
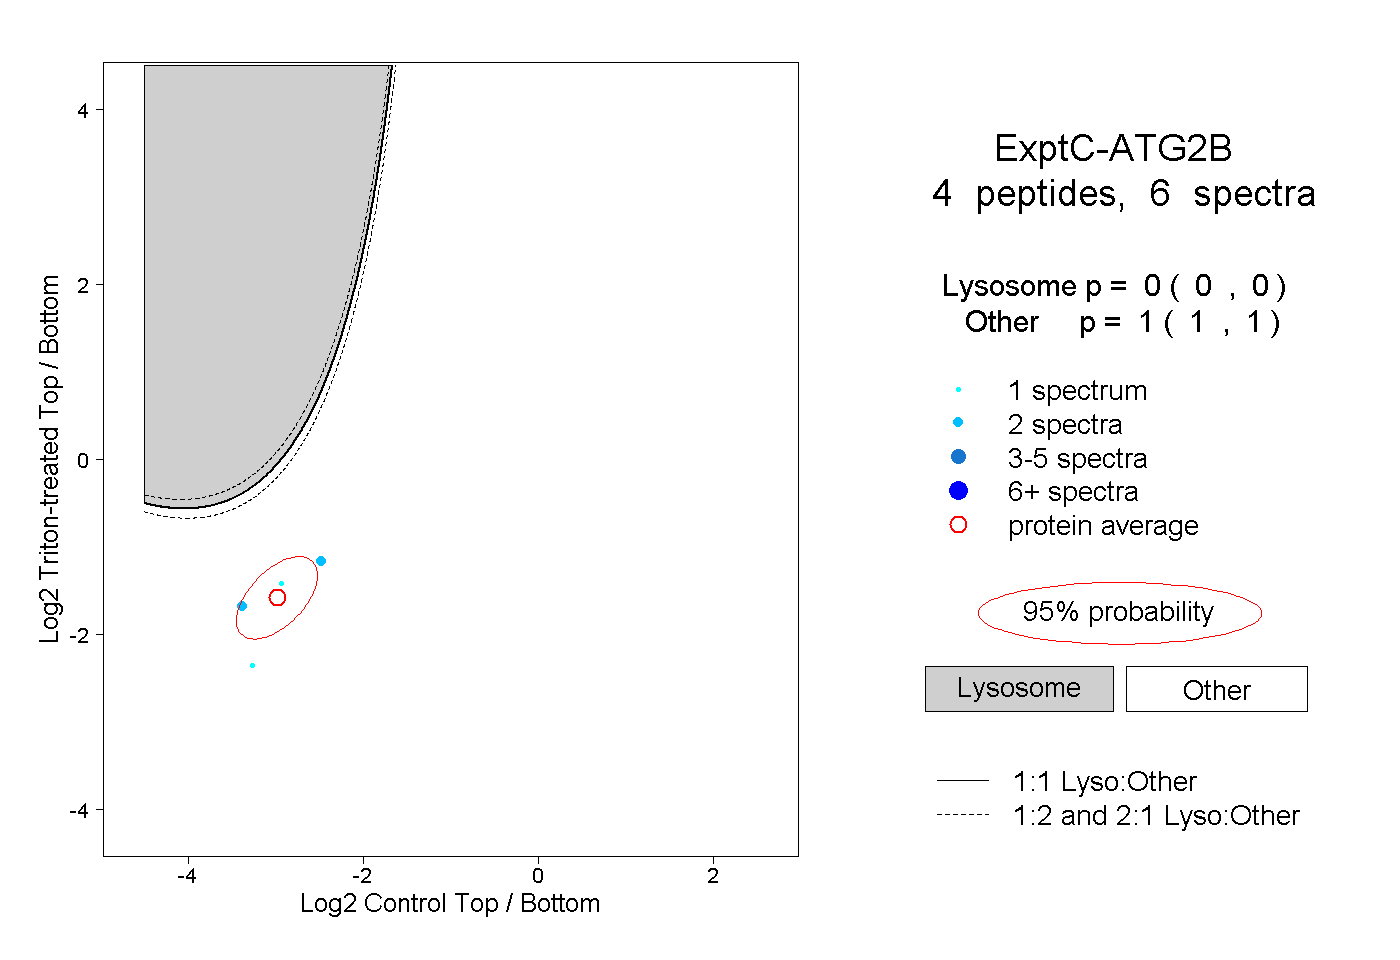 |
0.000 0.000 | 0.000 |
1.000 1.000 | 1.000 |