 2
2peptides
spectra
0.000 | 0.000
0.000 | 0.000
0.126 | 0.292
0.000 | 0.122
0.015 | 0.360
0.154 | 0.396
0.170 | 0.284
0.000 | 0.000
2peptides
spectra
0.000 | 0.000
1.000 | 1.000
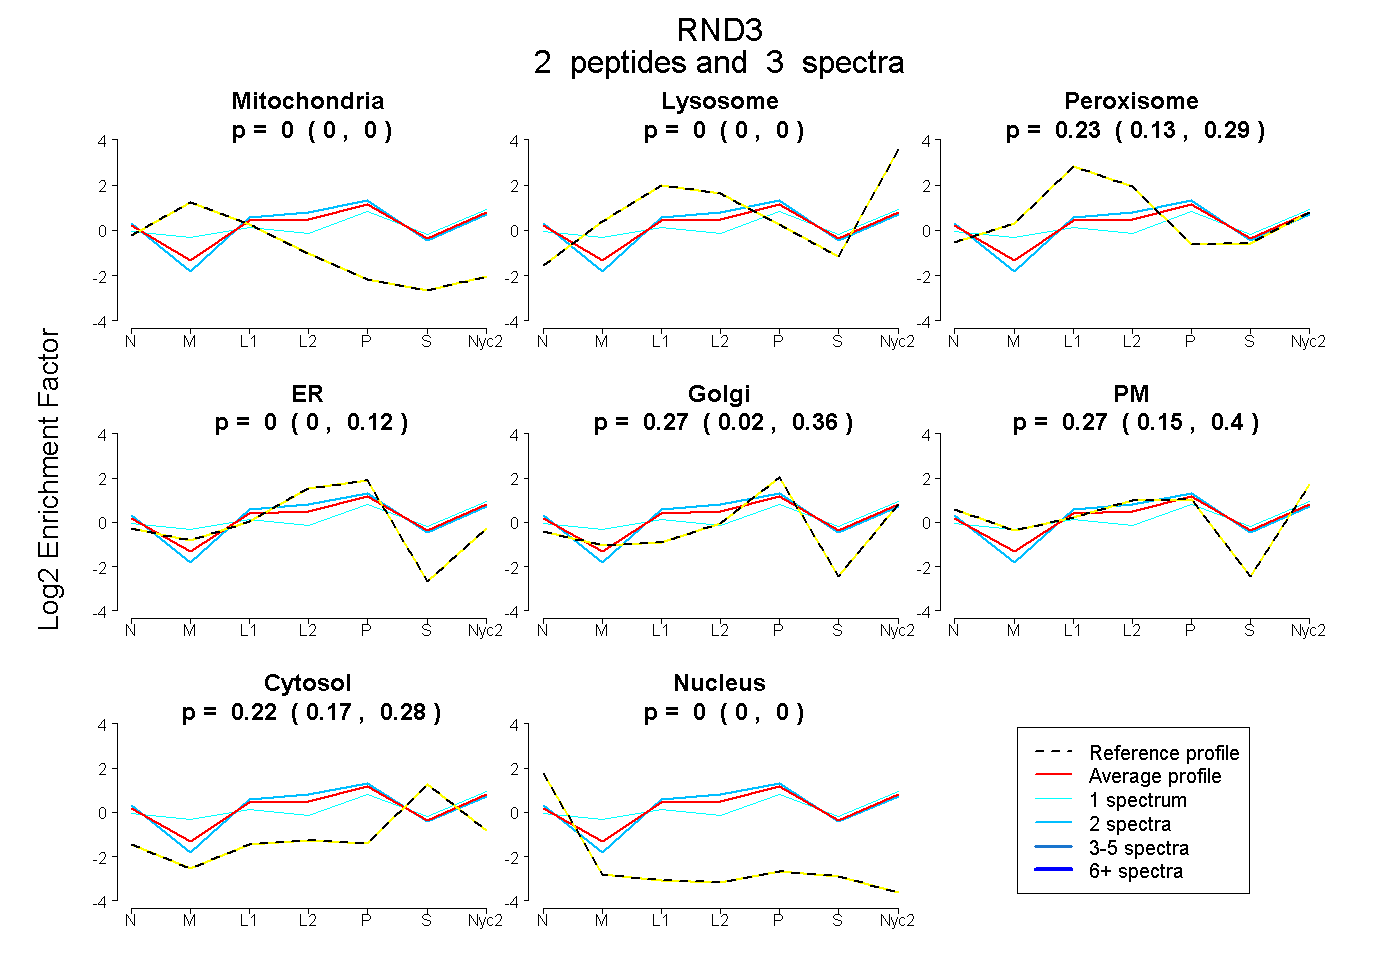
| Plot | Mito | Lyso | Perox | ER | Golgi | PM | Cytosol | Nucleus | |||||
| Expt A |
2 peptides |
3 spectra |
|
0.000 0.000 | 0.000 |
0.000 0.000 | 0.000 |
0.234 0.126 | 0.292 |
0.000 0.000 | 0.122 |
0.271 0.015 | 0.360 |
0.270 0.154 | 0.396 |
0.224 0.170 | 0.284 |
0.000 0.000 | 0.000 |
||
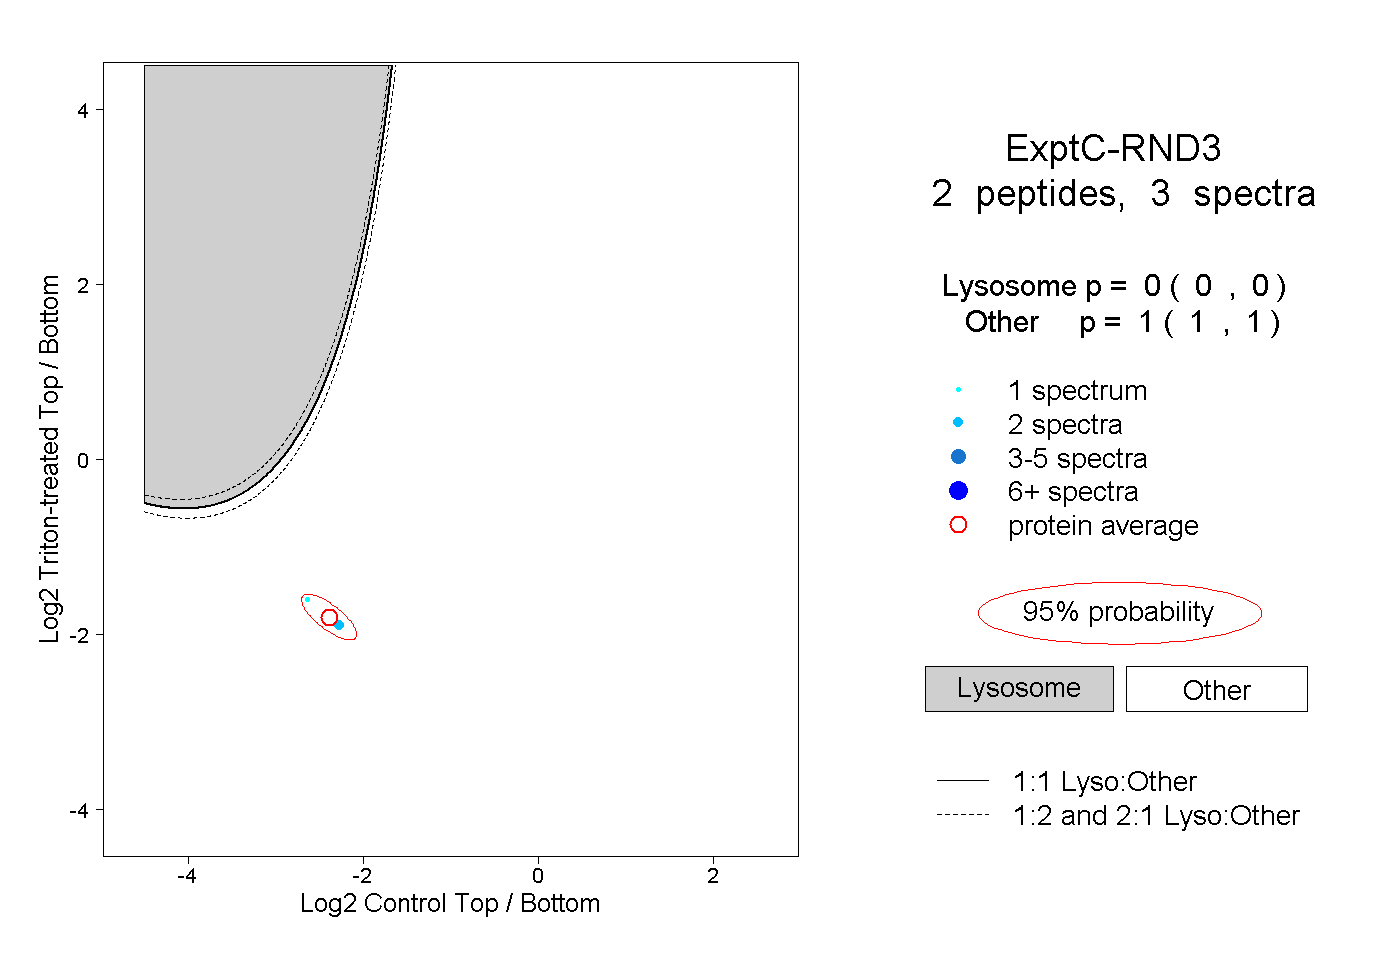
| Plot | Lyso | Other | |||||||||||
| Expt C |
2 peptides |
3 spectra |
|
0.000 0.000 | 0.000 |
1.000 1.000 | 1.000 |