40
40peptides
spectra
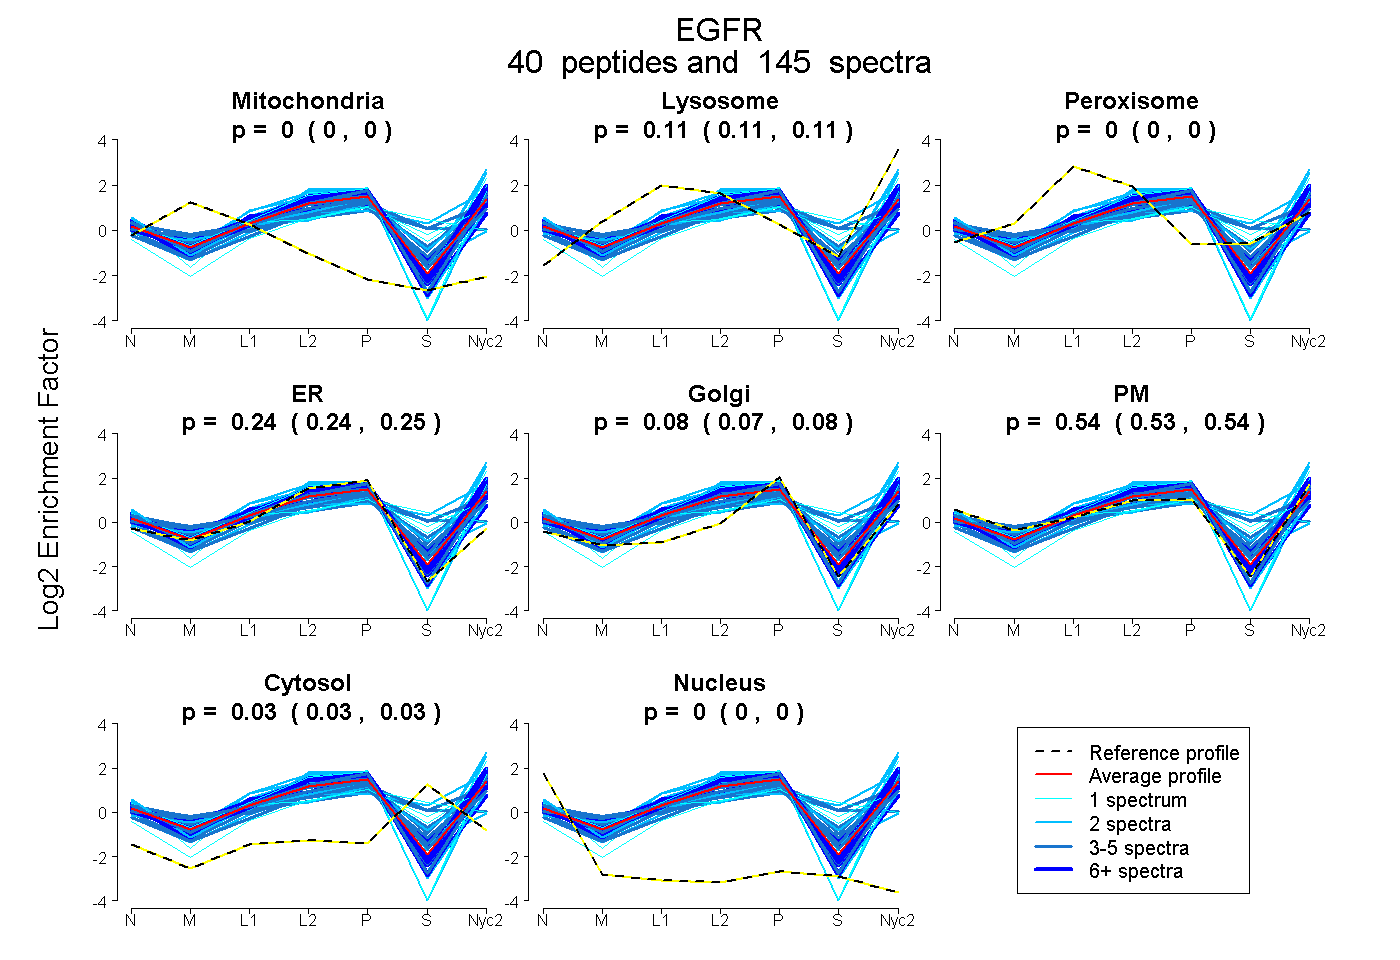
0.000 | 0.000
0.106 | 0.112
0.000 | 0.000
0.237 | 0.248
0.072 | 0.084
0.534 | 0.542
0.027 | 0.033
0.000 | 0.000
11peptides
spectra
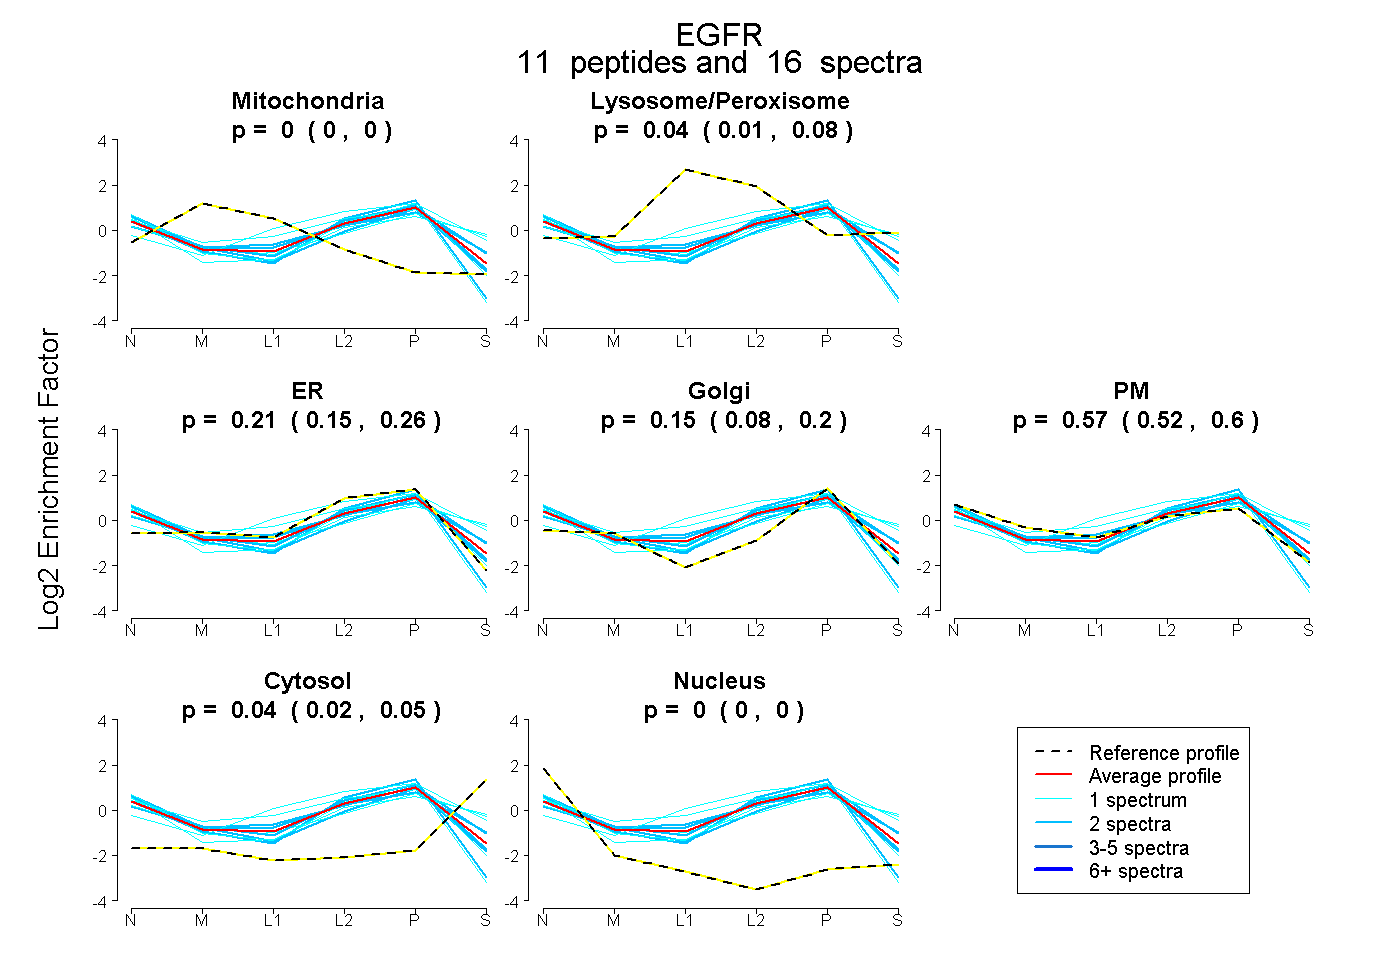
0.000 | 0.000
0.005 | 0.076
0.148 | 0.260
0.084 | 0.196
0.525 | 0.601
0.020 | 0.050
0.000 | 0.000