15
15peptides
spectra
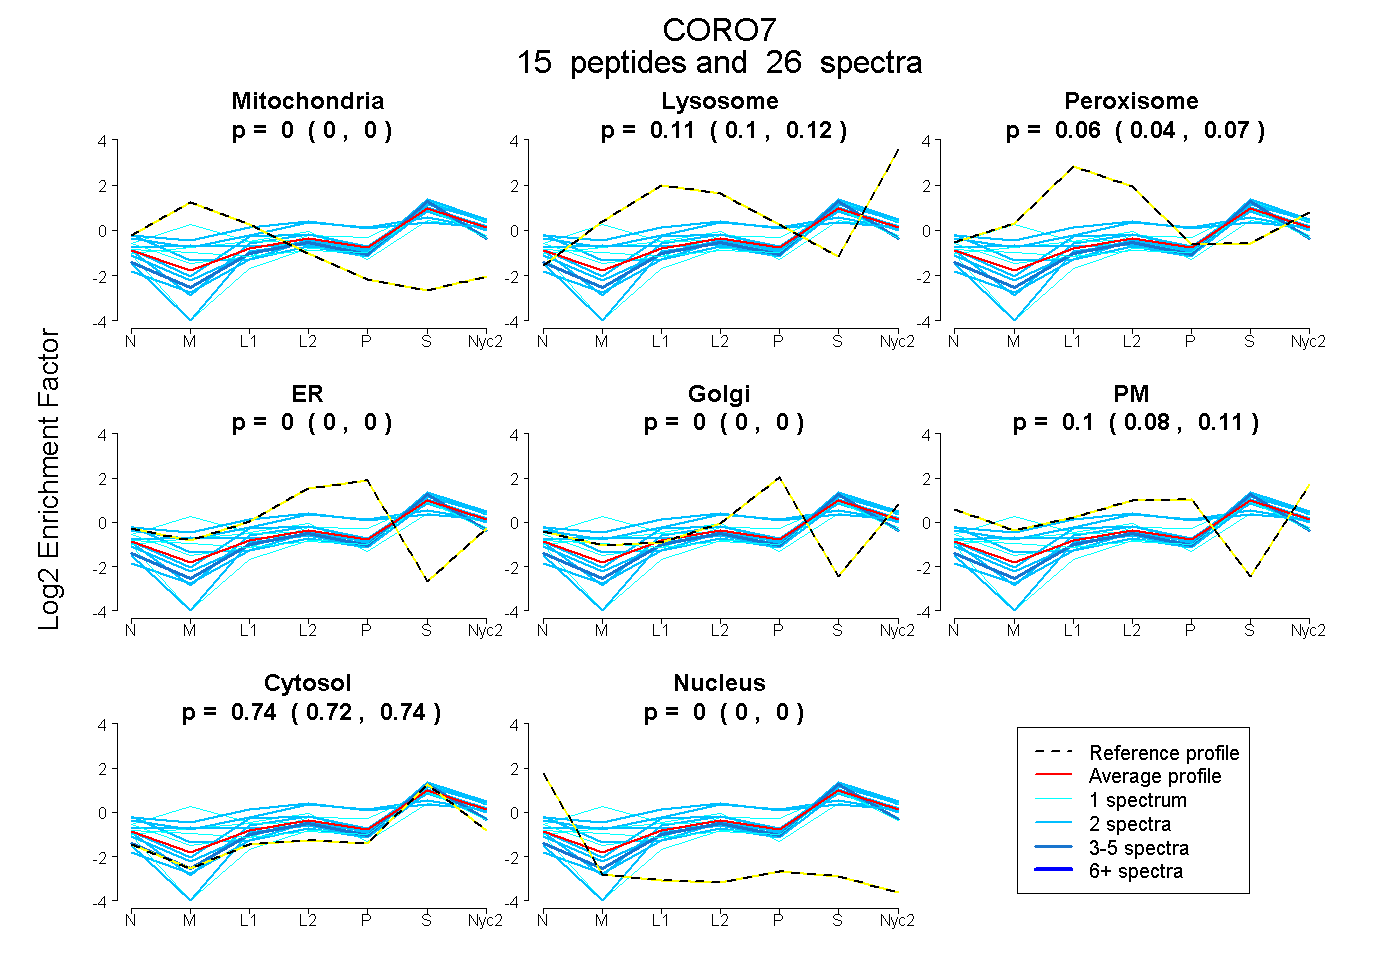
0.000 | 0.000
0.098 | 0.122
0.039 | 0.069
0.000 | 0.000
0.000 | 0.000
0.085 | 0.108
0.725 | 0.744
0.000 | 0.000
5peptides
spectra
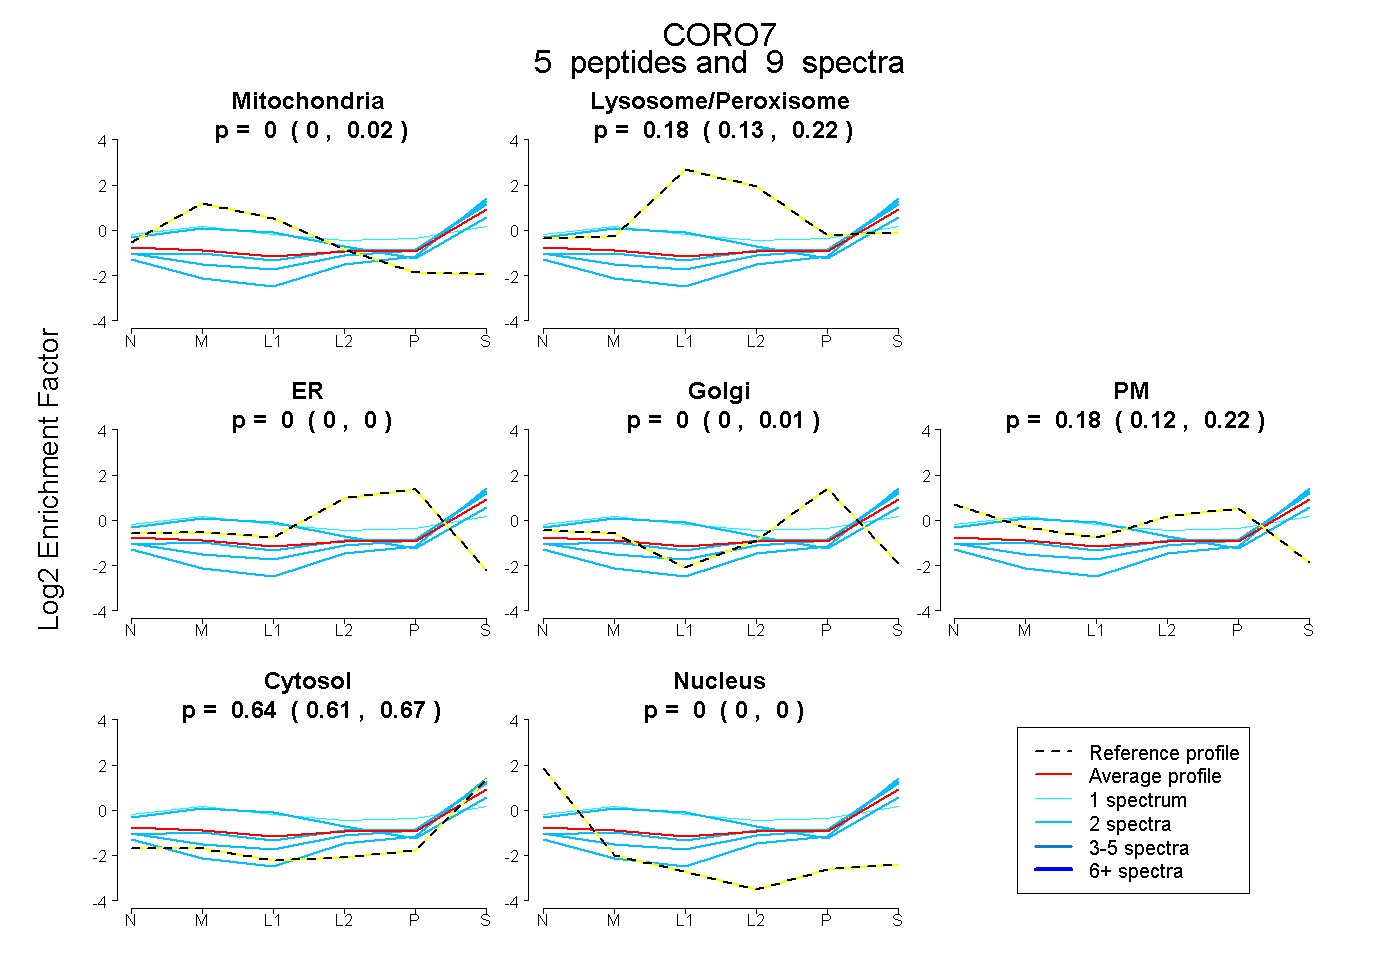
0.000 | 0.016
0.128 | 0.224
0.000 | 0.000
0.000 | 0.010
0.115 | 0.218
0.611 | 0.667
0.000 | 0.000
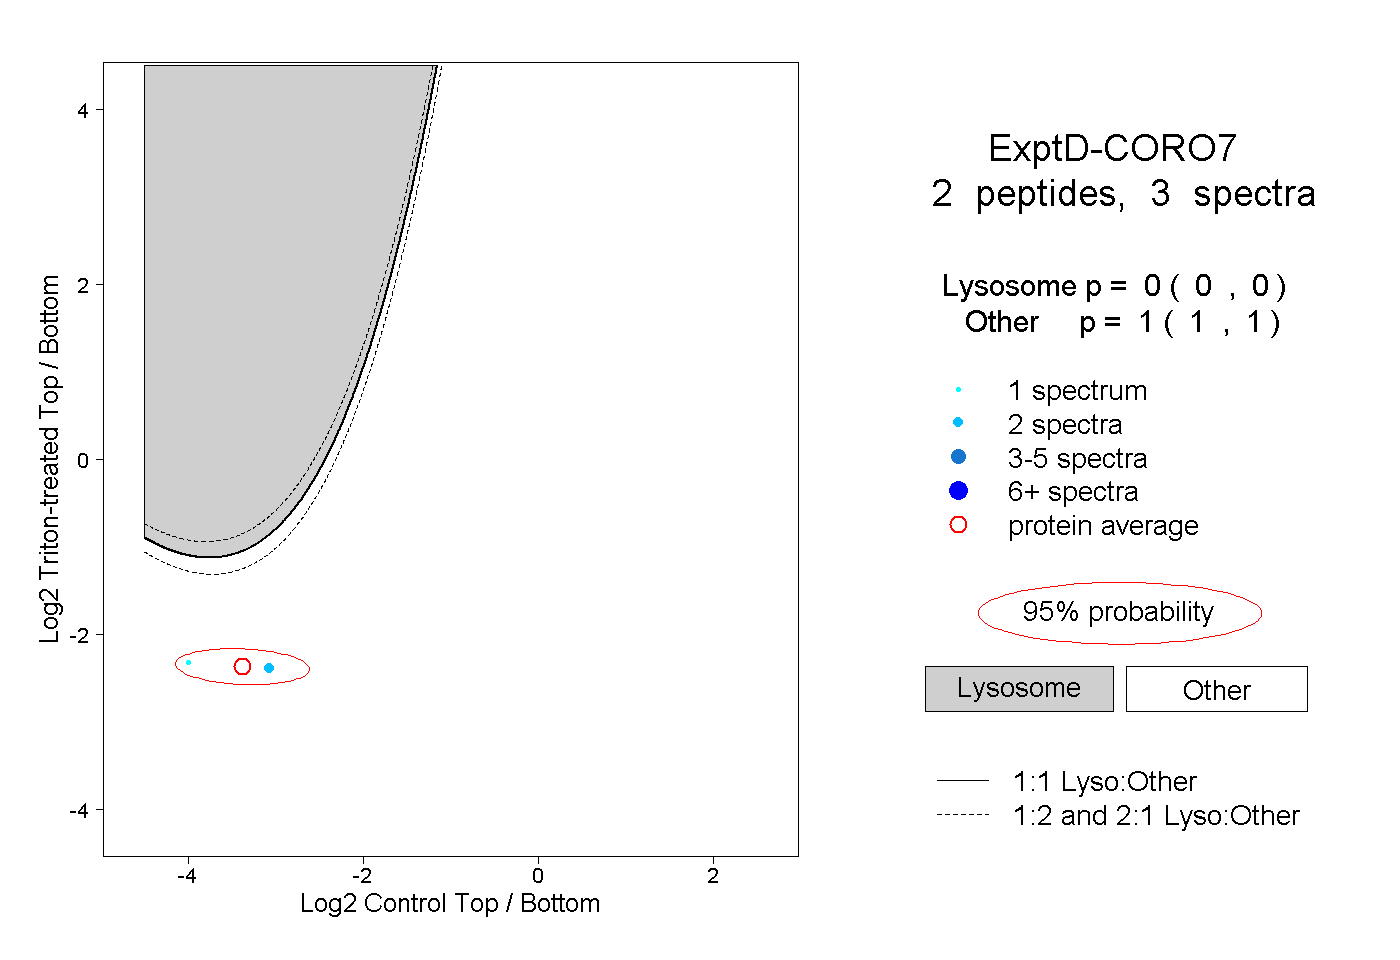
14peptides
spectra
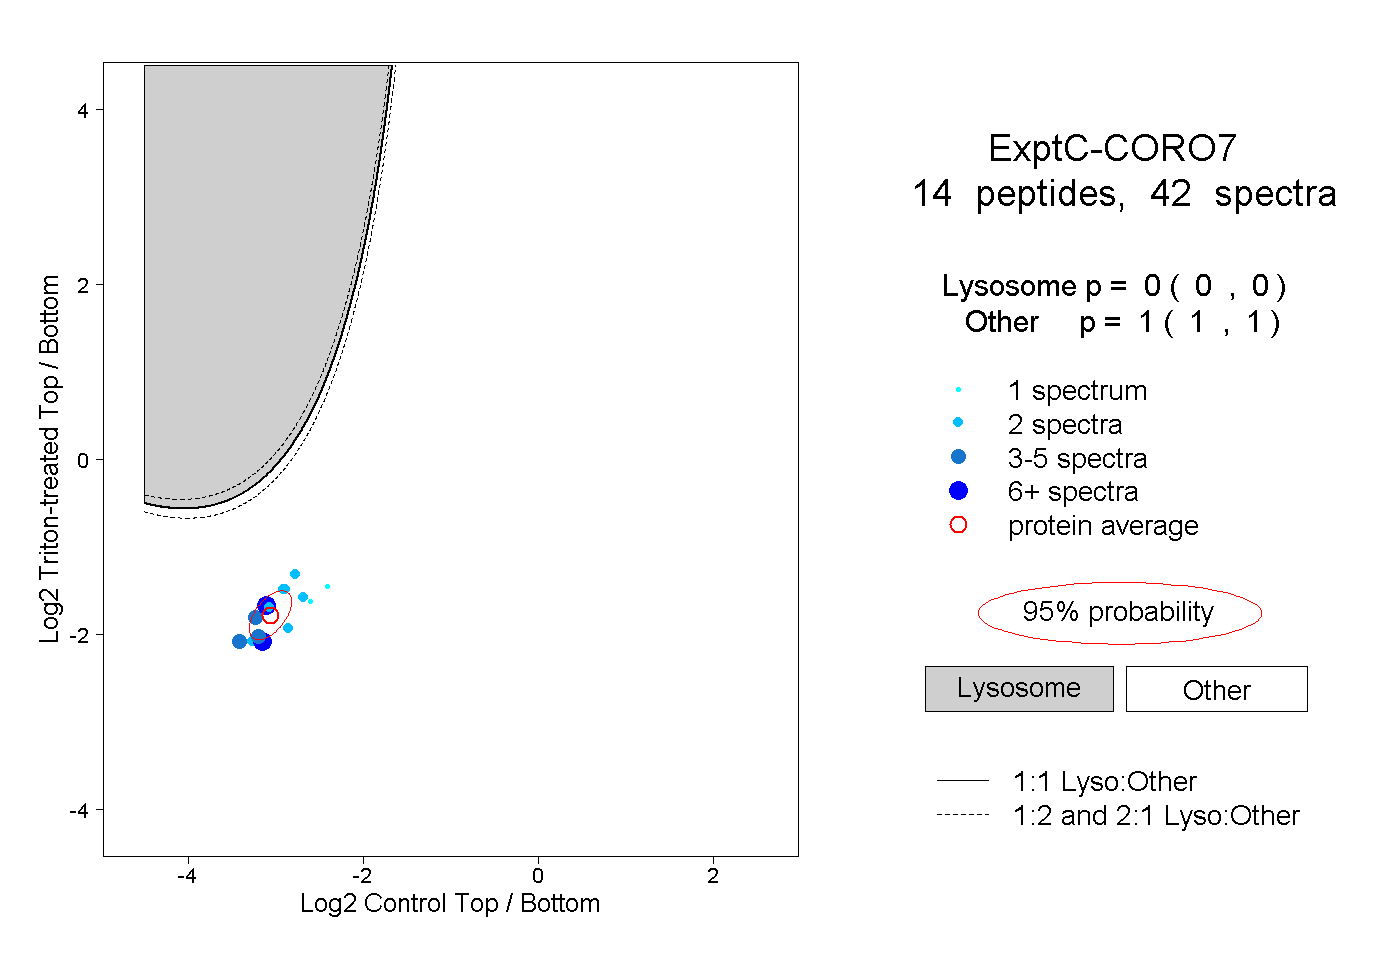
0.000 | 0.000
1.000 | 1.000