 15
15peptides
spectra
0.000 | 0.000
0.098 | 0.122
0.039 | 0.069
0.000 | 0.000
0.000 | 0.000
0.085 | 0.108
0.725 | 0.744
0.000 | 0.000
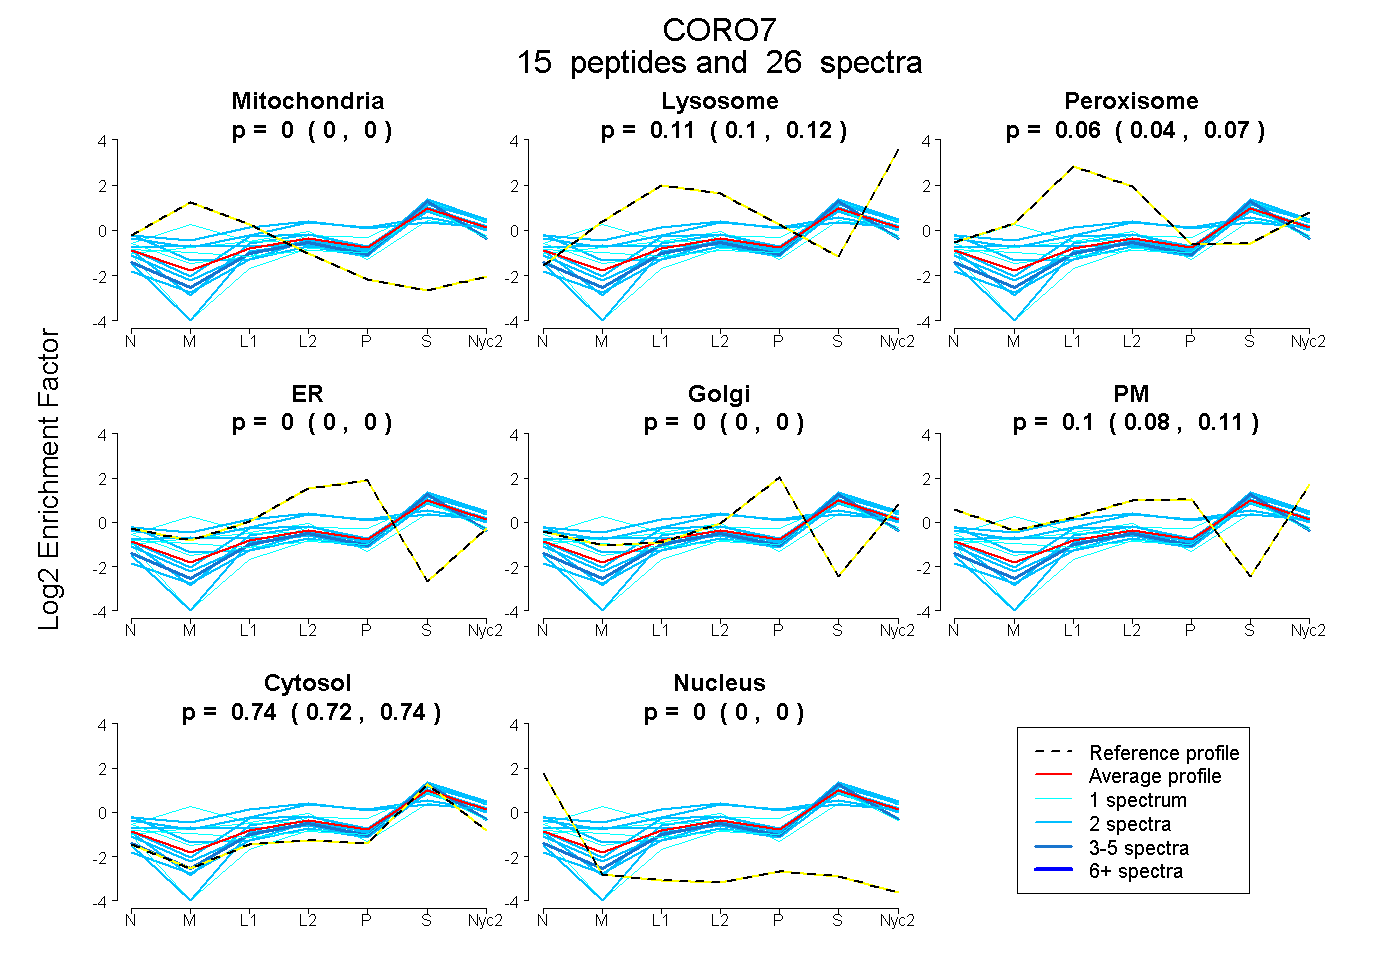
| Plot | Mito | Lyso | Perox | ER | Golgi | PM | Cytosol | Nucleus | |||||
| Expt A |
15 peptides |
26 spectra |
|
0.000 0.000 | 0.000 |
0.111 0.098 | 0.122 |
0.056 0.039 | 0.069 |
0.000 0.000 | 0.000 |
0.000 0.000 | 0.000 |
0.098 0.085 | 0.108 |
0.735 0.725 | 0.744 |
0.000 0.000 | 0.000 |
| 2 spectra, SSPLPLQDGPGPEGGR | 0.000 | 0.104 | 0.155 | 0.000 | 0.000 | 0.045 | 0.697 | 0.000 | ||
| 2 spectra, VSLNPAHRPHPR | 0.000 | 0.000 | 0.351 | 0.015 | 0.085 | 0.158 | 0.391 | 0.000 | ||
| 2 spectra, SLQSLLGPSSK | 0.000 | 0.100 | 0.000 | 0.000 | 0.000 | 0.000 | 0.900 | 0.000 | ||
| 2 spectra, QTSLEPVAFR | 0.000 | 0.193 | 0.000 | 0.000 | 0.000 | 0.009 | 0.798 | 0.000 | ||
| 2 spectra, AQASQSTQAHENNR | 0.000 | 0.180 | 0.000 | 0.000 | 0.000 | 0.038 | 0.782 | 0.000 | ||
| 1 spectrum, VPPGGLK | 0.115 | 0.090 | 0.006 | 0.000 | 0.000 | 0.057 | 0.732 | 0.000 | ||
| 1 spectrum, FHPLAADVLASSSYDLTIR | 0.249 | 0.188 | 0.120 | 0.000 | 0.000 | 0.000 | 0.443 | 0.000 | ||
| 1 spectrum, IWDLQAGTEQLR | 0.067 | 0.201 | 0.089 | 0.000 | 0.000 | 0.000 | 0.642 | 0.000 | ||
| 2 spectra, LAVAGEDAR | 0.118 | 0.188 | 0.048 | 0.000 | 0.000 | 0.000 | 0.646 | 0.000 | ||
| 2 spectra, HAEGTILHR | 0.000 | 0.000 | 0.020 | 0.000 | 0.000 | 0.273 | 0.707 | 0.000 | ||
| 1 spectrum, QLATVCK | 0.000 | 0.000 | 0.046 | 0.051 | 0.000 | 0.203 | 0.700 | 0.000 | ||
| 2 spectra, GLNLTTPGESDGFCANR | 0.000 | 0.000 | 0.263 | 0.053 | 0.060 | 0.160 | 0.463 | 0.000 | ||
| 2 spectra, DLVQSAVWSR | 0.000 | 0.124 | 0.000 | 0.000 | 0.000 | 0.000 | 0.876 | 0.000 | ||
| 1 spectrum, EELLNAMVAK | 0.000 | 0.006 | 0.000 | 0.000 | 0.064 | 0.000 | 0.930 | 0.000 | ||
| 3 spectra, TECDIQDVEFAR | 0.000 | 0.084 | 0.035 | 0.000 | 0.000 | 0.000 | 0.882 | 0.000 |
| Plot | Mito | Lyso or Perox | ER | Golgi | PM | Cytosol | Nucleus | ||||||
| Expt B |
5 peptides |
9 spectra |
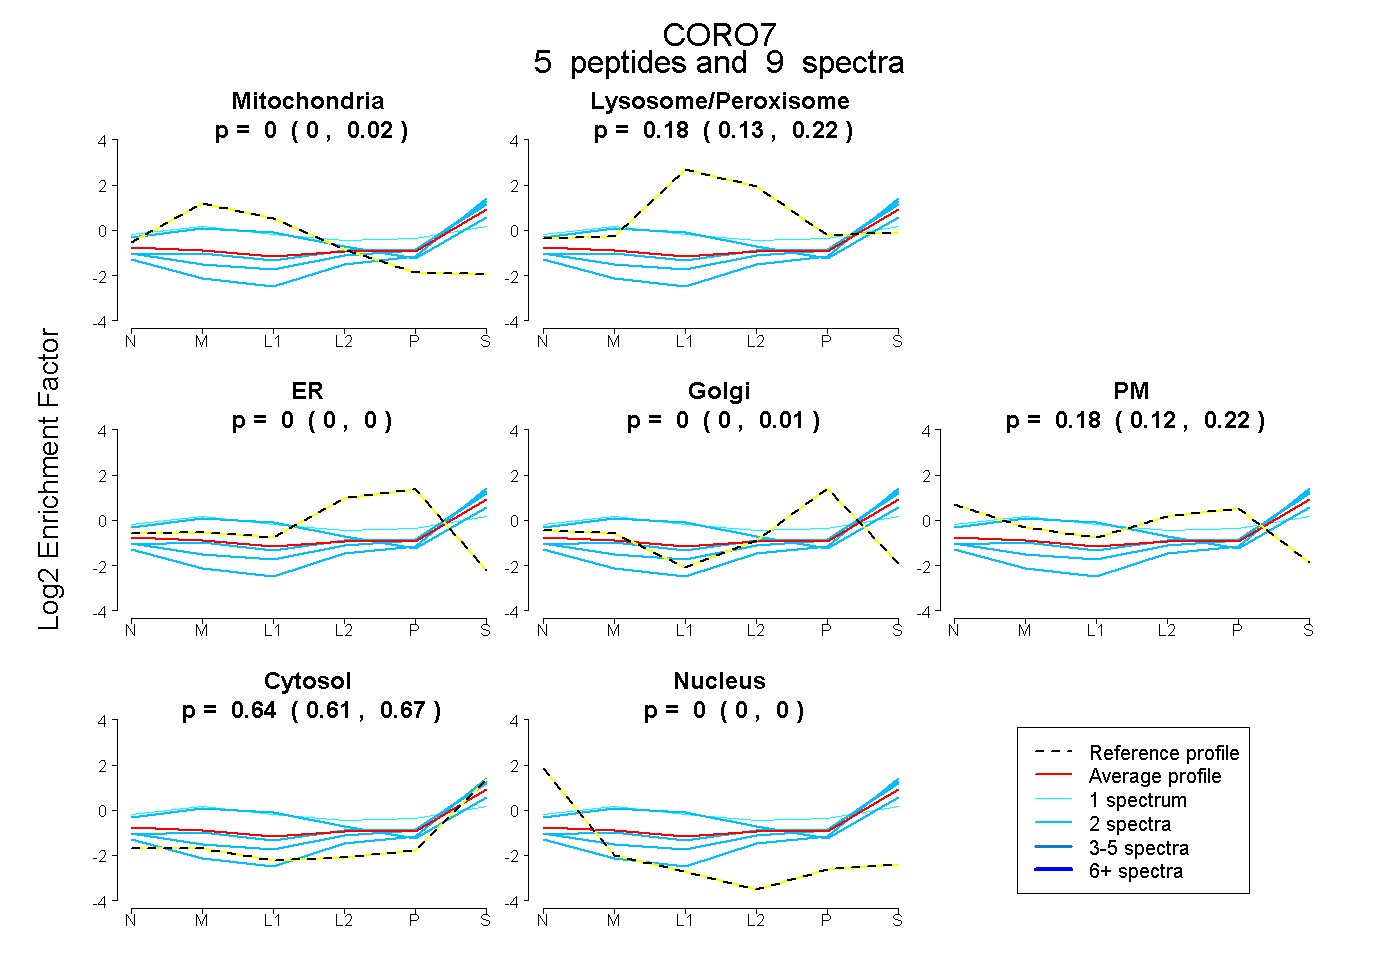 |
0.000 0.000 | 0.016 |
0.182 0.128 | 0.224 |
0.000 0.000 | 0.000 |
0.000 0.000 | 0.010 |
0.176 0.115 | 0.218 |
0.642 0.611 | 0.667 |
0.000 0.000 | 0.000 |
|||
| Plot | Lyso | Other | |||||||||||
| Expt C |
14 peptides |
42 spectra |
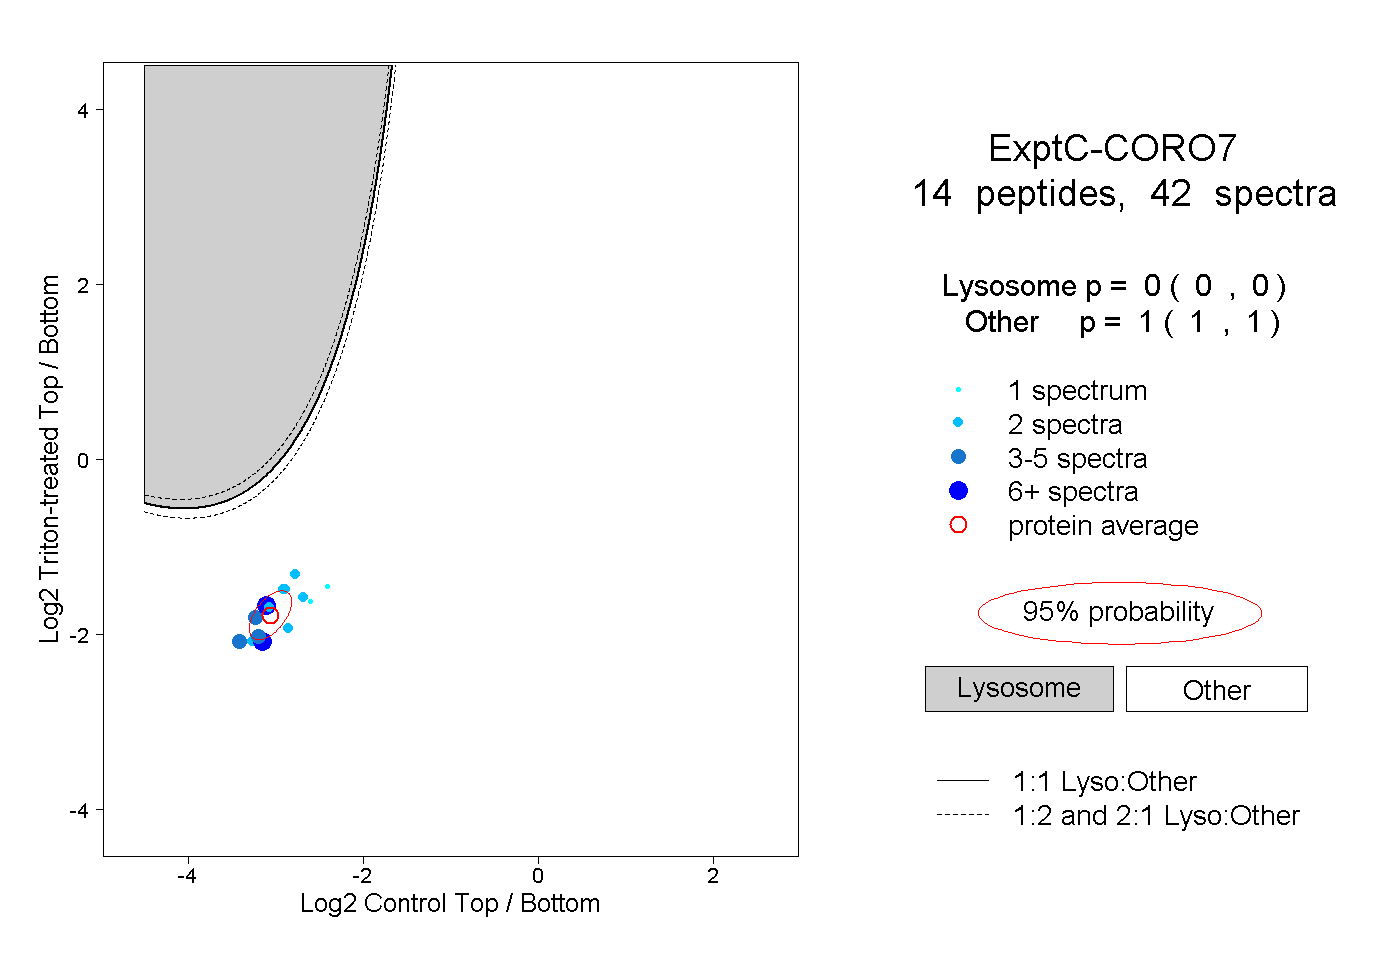 |
0.000 0.000 | 0.000 |
1.000 1.000 | 1.000 |
||||||||
| Plot | Lyso | Other | |||||||||||
| Expt D |
2 peptides |
3 spectra |
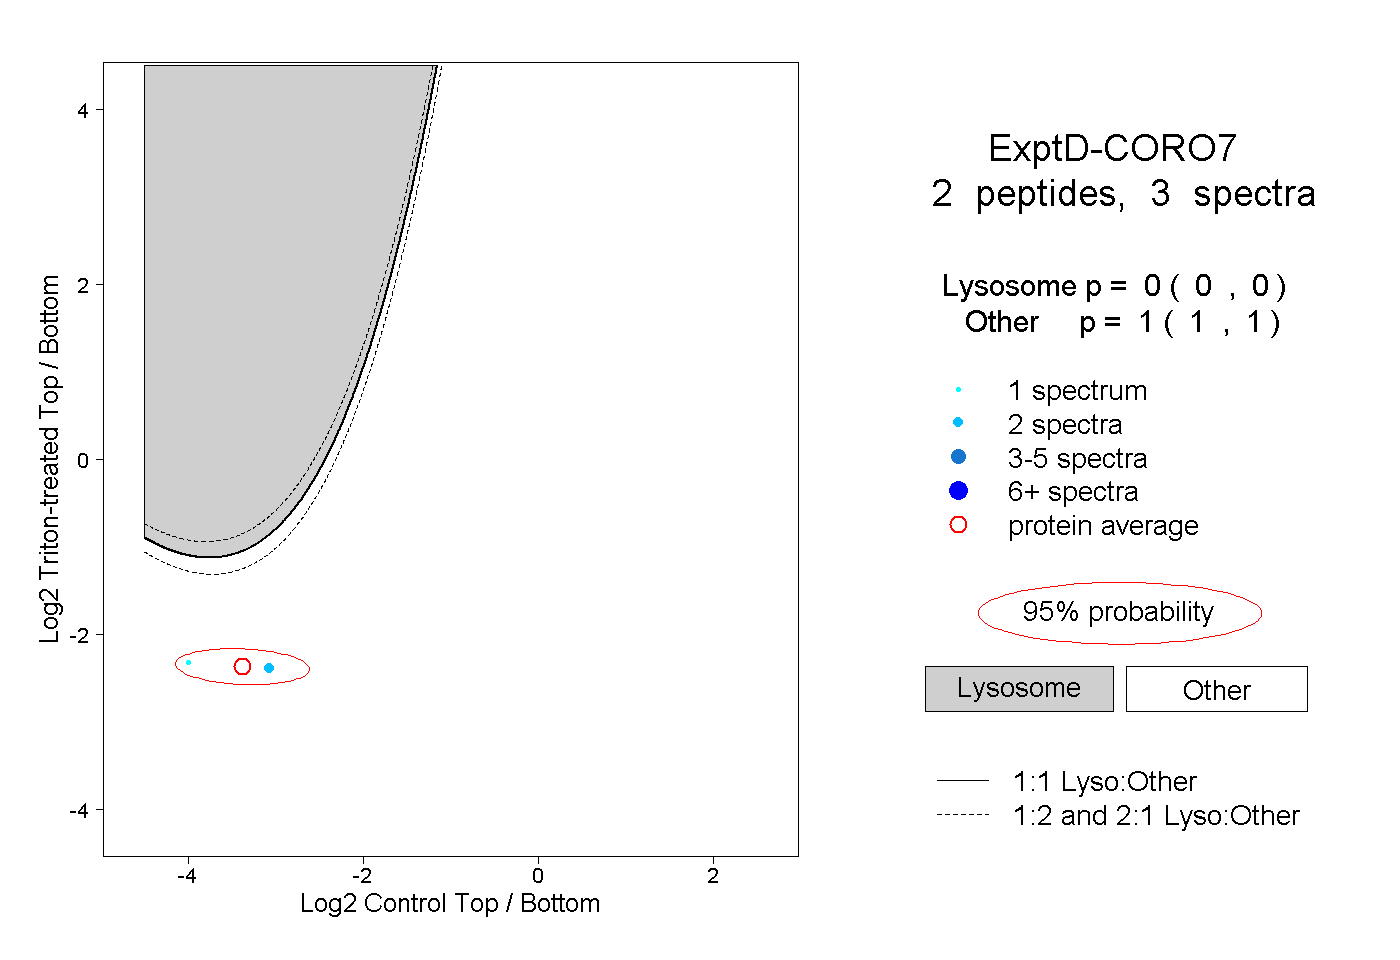 |
0.000 0.000 | 0.000 |
1.000 1.000 | 1.000 |