 3
3peptides
spectra

0.688 | 0.740
0.000 | 0.058
0.000 | 0.000
0.000 | 0.000
0.000 | 0.000
0.210 | 0.290
0.000 | 0.000
0.000 | 0.000
1peptide
spectrum
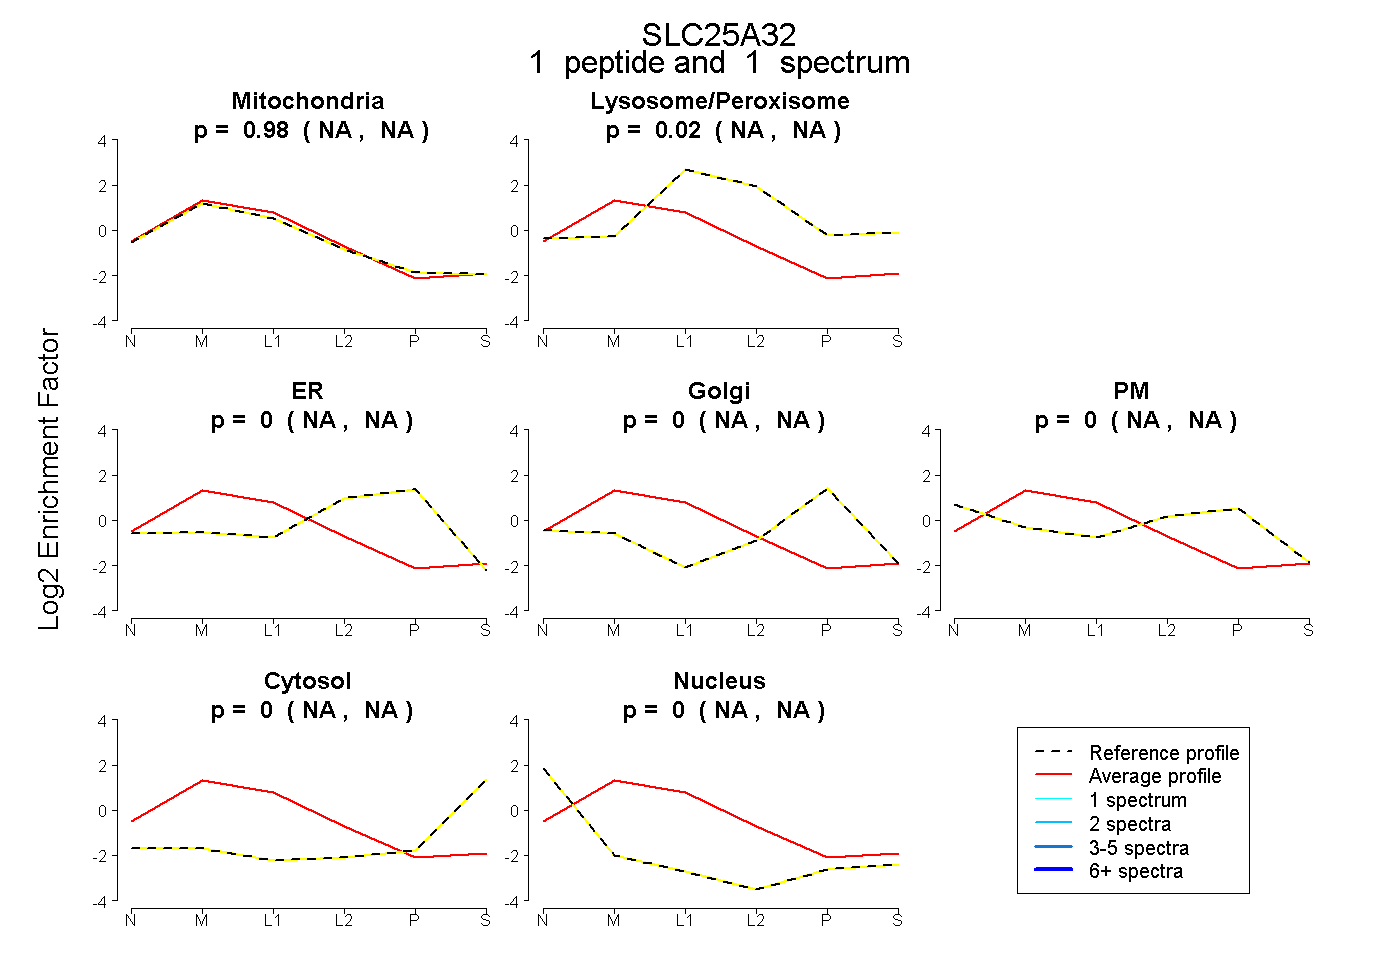
NA | NA
NA | NA
NA | NA
NA | NA
NA | NA
NA | NA
NA | NA
5peptides
spectra
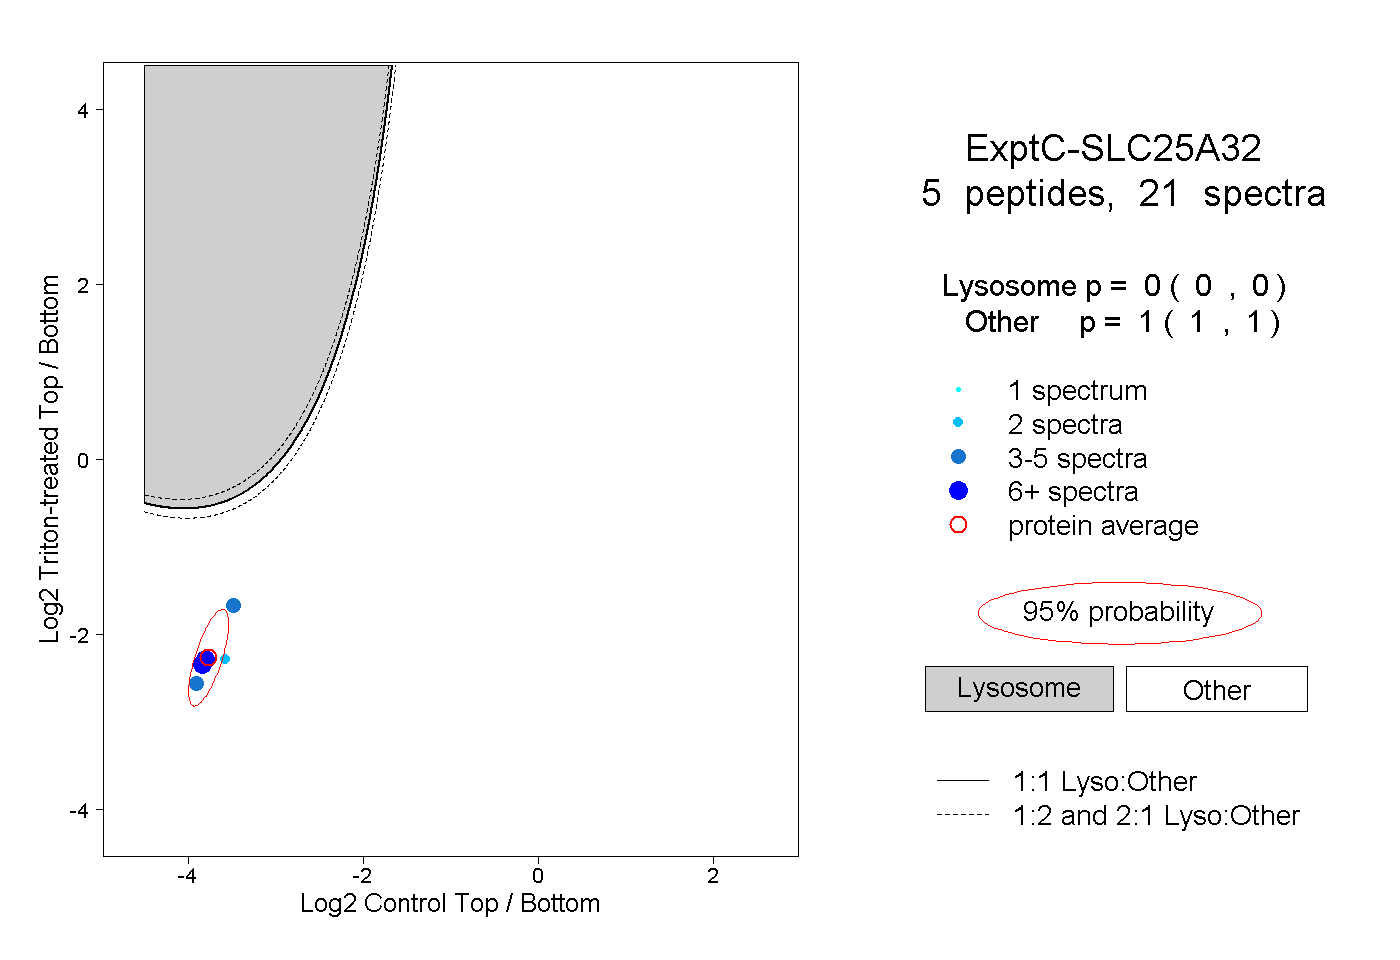
0.000 | 0.000
1.000 | 1.000
2peptides
spectra
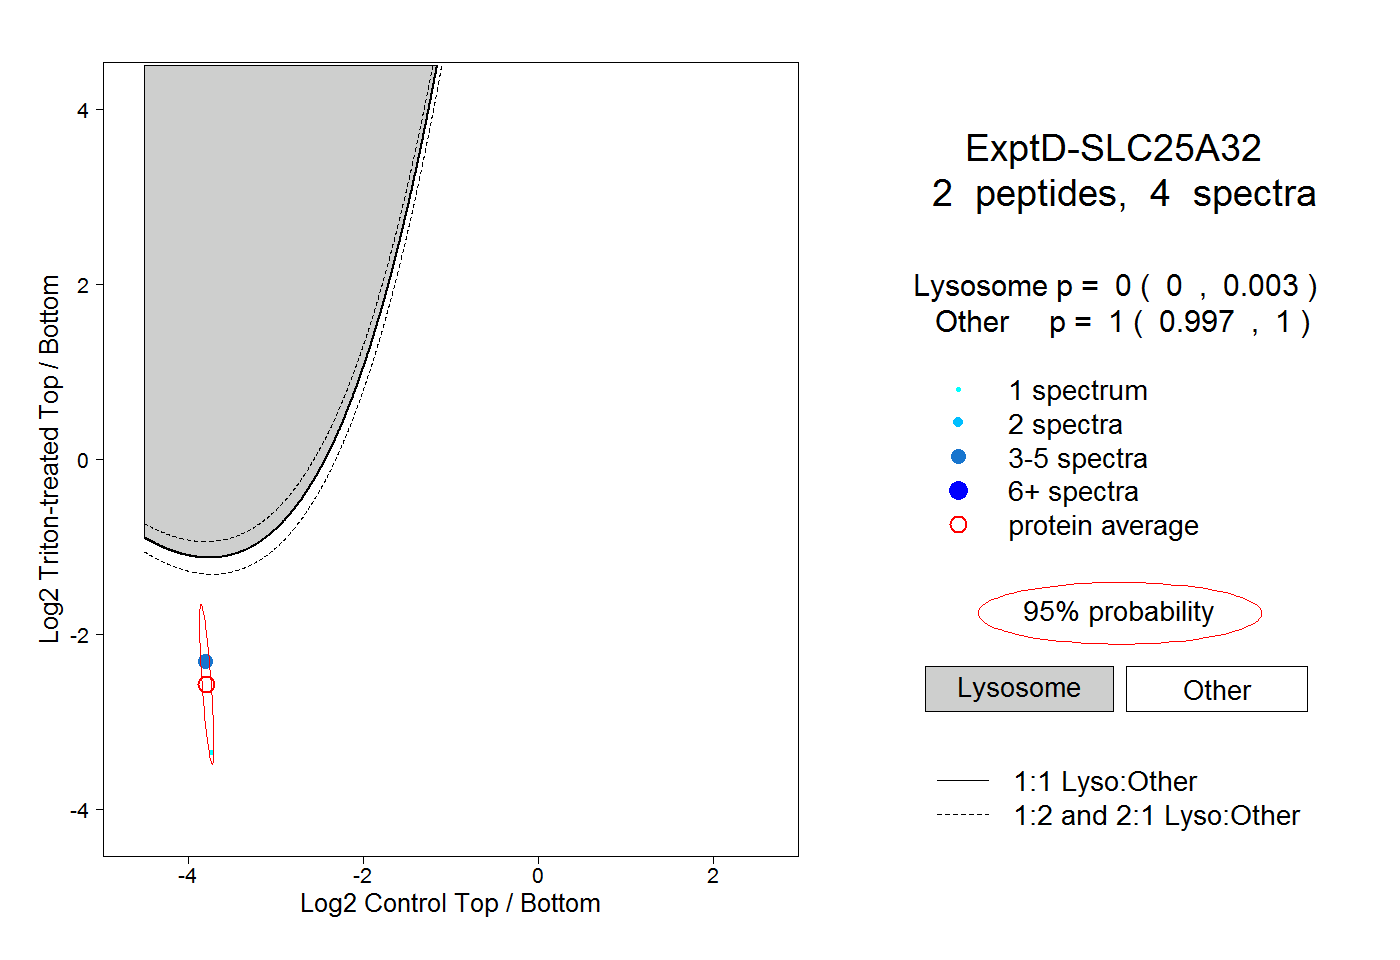
0.000 | 0.003
0.997 | 1.000