 6
6peptides
spectra
0.000 | 0.000
0.000 | 0.000
0.000 | 0.000
0.000 | 0.187
0.571 | 0.798
0.000 | 0.000
0.000 | 0.074
0.136 | 0.201
3peptides
spectra
0.000 | 0.000
1.000 | 1.000
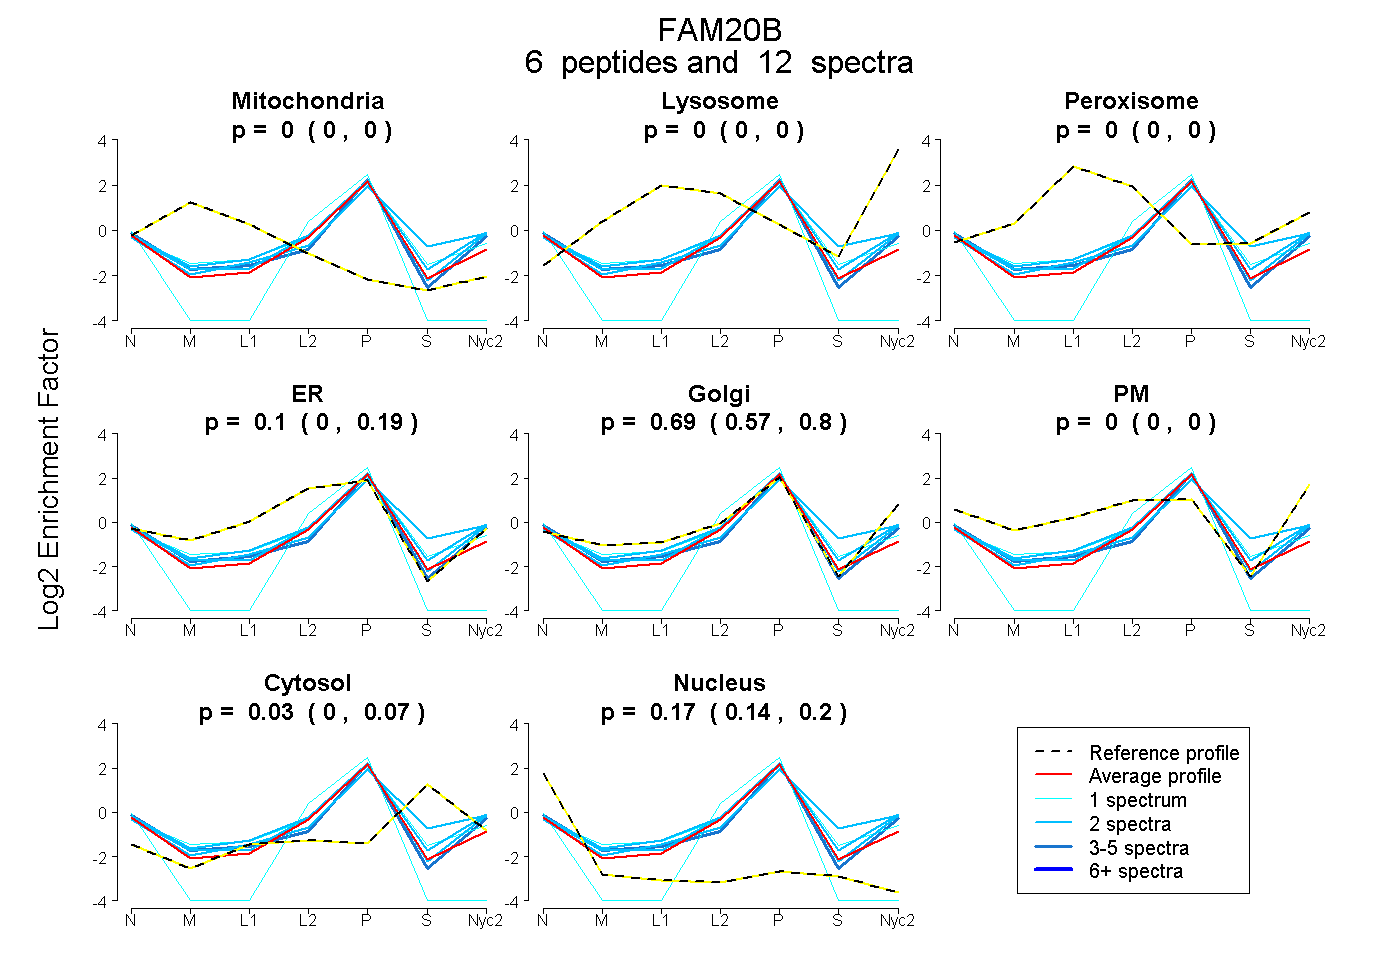
| Plot | Mito | Lyso | Perox | ER | Golgi | PM | Cytosol | Nucleus | |||||
| Expt A |
6 peptides |
12 spectra |
|
0.000 0.000 | 0.000 |
0.000 0.000 | 0.000 |
0.000 0.000 | 0.000 |
0.103 0.000 | 0.187 |
0.690 0.571 | 0.798 |
0.000 0.000 | 0.000 |
0.034 0.000 | 0.074 |
0.173 0.136 | 0.201 |
||
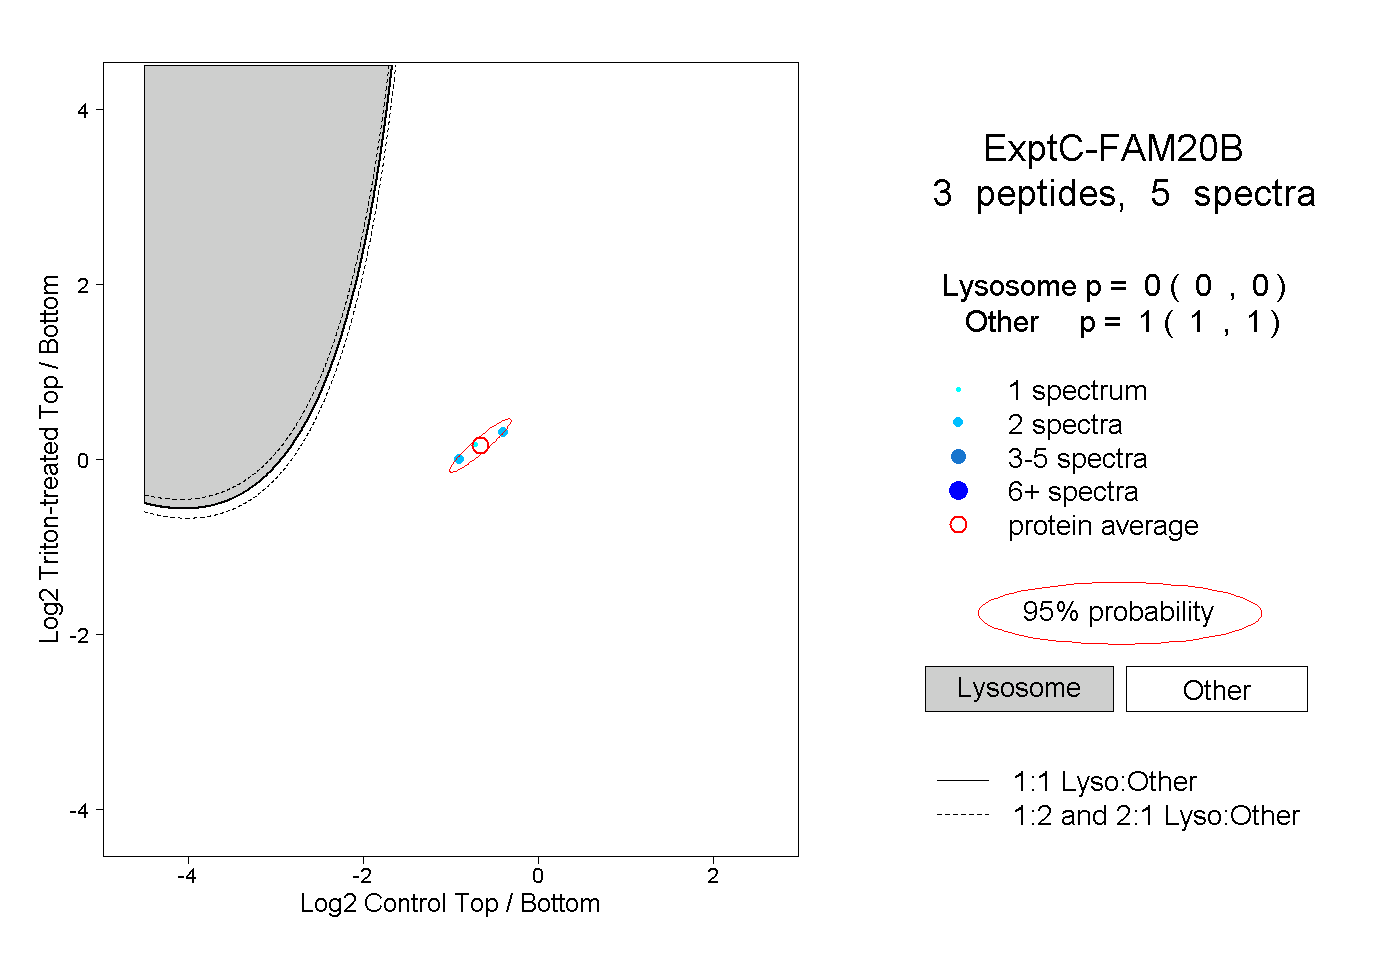
| Plot | Lyso | Other | |||||||||||
| Expt C |
3 peptides |
5 spectra |
|
0.000 0.000 | 0.000 |
1.000 1.000 | 1.000 |
| 2 spectra, DYVVEGEPYAGYDR | 0.000 | 1.000 | ||||||||
| 2 spectra, SFGNPSLDER | 0.000 | 1.000 | ||||||||
| 1 spectrum, ADVGYK | 0.000 | 1.000 |
| Plot | Lyso | Other | |||||||||||
| Expt D |
1 peptide |
1 spectrum |
 |
0.000 NA | NA |
1.000 NA | NA |