 21
21peptides
spectra
0.000 | 0.000
0.000 | 0.000
0.038 | 0.043
0.000 | 0.000
0.000 | 0.000
0.164 | 0.171
0.706 | 0.710
0.081 | 0.085
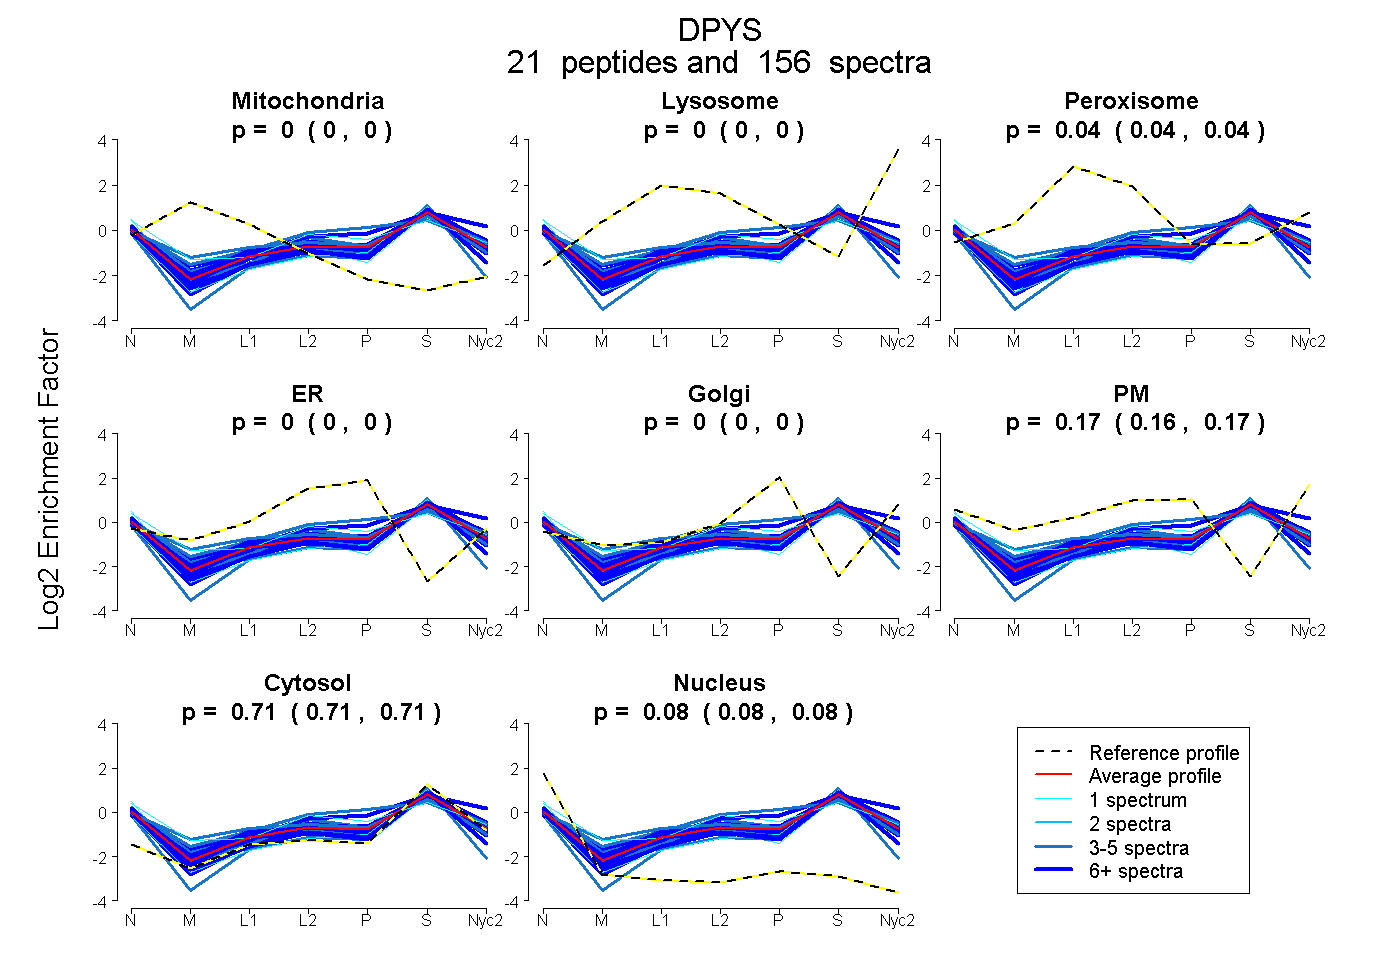
| Plot | Mito | Lyso | Perox | ER | Golgi | PM | Cytosol | Nucleus | |||||
| Expt A |
21 peptides |
156 spectra |
|
0.000 0.000 | 0.000 |
0.000 0.000 | 0.000 |
0.041 0.038 | 0.043 |
0.000 0.000 | 0.000 |
0.000 0.000 | 0.000 |
0.168 0.164 | 0.171 |
0.708 0.706 | 0.710 |
0.083 0.081 | 0.085 |
| 11 spectra, MSVIWEK | 0.000 | 0.000 | 0.000 | 0.188 | 0.000 | 0.113 | 0.699 | 0.000 | ||
| 7 spectra, GVNSFK | 0.000 | 0.000 | 0.000 | 0.111 | 0.000 | 0.029 | 0.758 | 0.101 | ||
| 1 spectrum, VVYGEPIAAGLGTDGTQYWNK | 0.000 | 0.000 | 0.059 | 0.021 | 0.000 | 0.290 | 0.545 | 0.085 | ||
| 12 spectra, VVYEAGVFDVTAGHGK | 0.000 | 0.000 | 0.042 | 0.050 | 0.000 | 0.000 | 0.741 | 0.167 | ||
| 13 spectra, GVHSGK | 0.000 | 0.000 | 0.000 | 0.000 | 0.000 | 0.296 | 0.704 | 0.000 | ||
| 5 spectra, ILDAAGK | 0.000 | 0.000 | 0.133 | 0.000 | 0.000 | 0.078 | 0.632 | 0.157 | ||
| 3 spectra, NWADPK | 0.000 | 0.000 | 0.027 | 0.242 | 0.000 | 0.131 | 0.588 | 0.012 | ||
| 17 spectra, GSSLIEAFETWR | 0.000 | 0.000 | 0.033 | 0.000 | 0.000 | 0.096 | 0.756 | 0.115 | ||
| 3 spectra, DQTCTPIPVK | 0.000 | 0.000 | 0.000 | 0.000 | 0.000 | 0.000 | 0.804 | 0.196 | ||
| 3 spectra, VIADAK | 0.011 | 0.000 | 0.157 | 0.000 | 0.000 | 0.176 | 0.589 | 0.068 | ||
| 6 spectra, QPFAEFIYK | 0.000 | 0.000 | 0.052 | 0.000 | 0.000 | 0.128 | 0.723 | 0.097 | ||
| 14 spectra, MFMAYK | 0.000 | 0.000 | 0.035 | 0.000 | 0.000 | 0.181 | 0.744 | 0.040 | ||
| 4 spectra, IPNGVNGVEDR | 0.000 | 0.000 | 0.000 | 0.019 | 0.000 | 0.211 | 0.699 | 0.072 | ||
| 8 spectra, FVAVTSTNAAK | 0.000 | 0.000 | 0.078 | 0.000 | 0.000 | 0.173 | 0.648 | 0.101 | ||
| 13 spectra, GEVITLKPR | 0.000 | 0.000 | 0.044 | 0.000 | 0.000 | 0.204 | 0.712 | 0.040 | ||
| 8 spectra, DLYMVQDQQMYAAFSQCK | 0.000 | 0.000 | 0.074 | 0.000 | 0.000 | 0.161 | 0.716 | 0.050 | ||
| 1 spectrum, AALAGGTTMIIDFAIPQK | 0.000 | 0.000 | 0.051 | 0.000 | 0.000 | 0.121 | 0.691 | 0.136 | ||
| 1 spectrum, MLALGITGPEGHELCRPEAVEAEATLR | 0.000 | 0.000 | 0.000 | 0.046 | 0.000 | 0.000 | 0.809 | 0.145 | ||
| 7 spectra, TLAQDK | 0.000 | 0.000 | 0.097 | 0.013 | 0.000 | 0.148 | 0.658 | 0.084 | ||
| 7 spectra, IFNLYPK | 0.000 | 0.000 | 0.082 | 0.000 | 0.000 | 0.178 | 0.664 | 0.076 | ||
| 12 spectra, DLLPPGDTSR | 0.000 | 0.000 | 0.027 | 0.000 | 0.000 | 0.146 | 0.712 | 0.115 |
| Plot | Mito | Lyso or Perox | ER | Golgi | PM | Cytosol | Nucleus | ||||||
| Expt B |
12 peptides |
51 spectra |
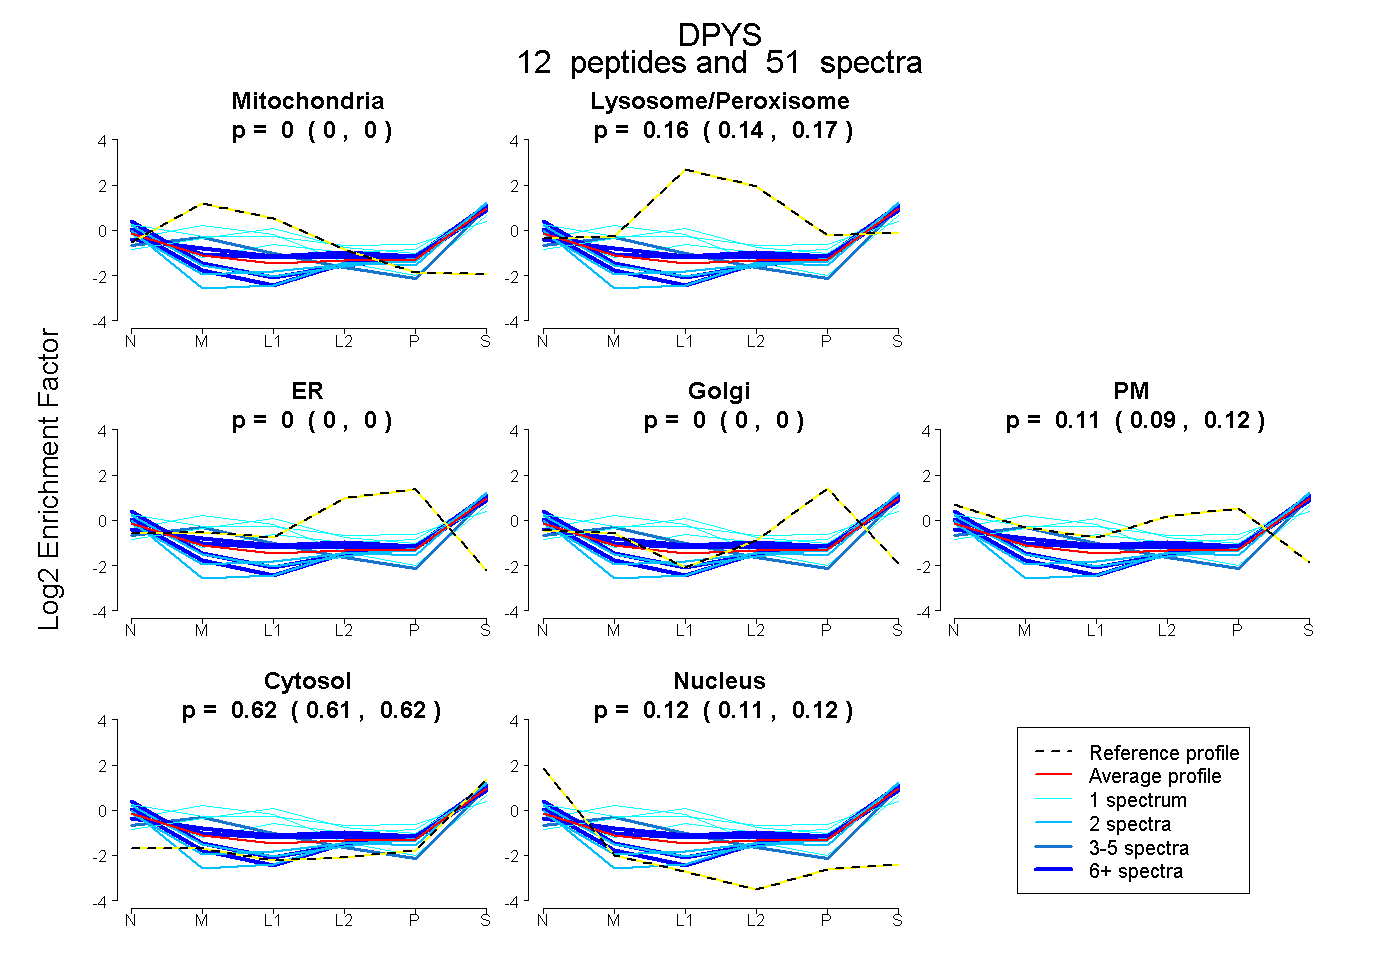 |
0.000 0.000 | 0.000 |
0.159 0.144 | 0.171 |
0.000 0.000 | 0.000 |
0.000 0.000 | 0.000 |
0.110 0.092 | 0.124 |
0.616 0.608 | 0.622 |
0.116 0.106 | 0.124 |
|||
| Plot | Lyso | Other | |||||||||||
| Expt C |
20 peptides |
266 spectra |
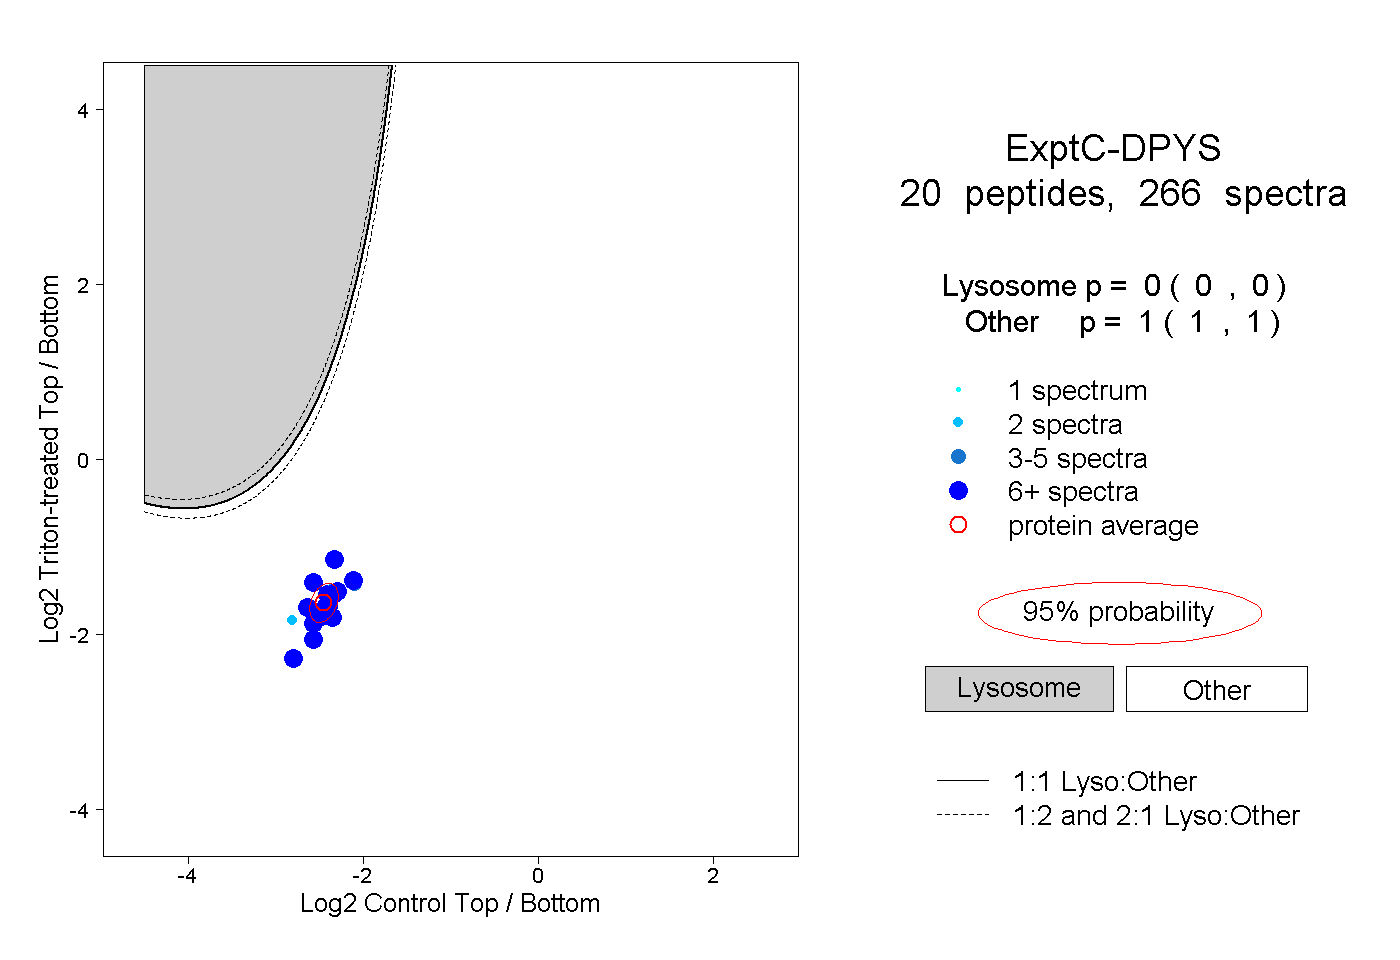 |
0.000 0.000 | 0.000 |
1.000 1.000 | 1.000 |
||||||||
| Plot | Lyso | Other | |||||||||||
| Expt D |
11 peptides |
26 spectra |
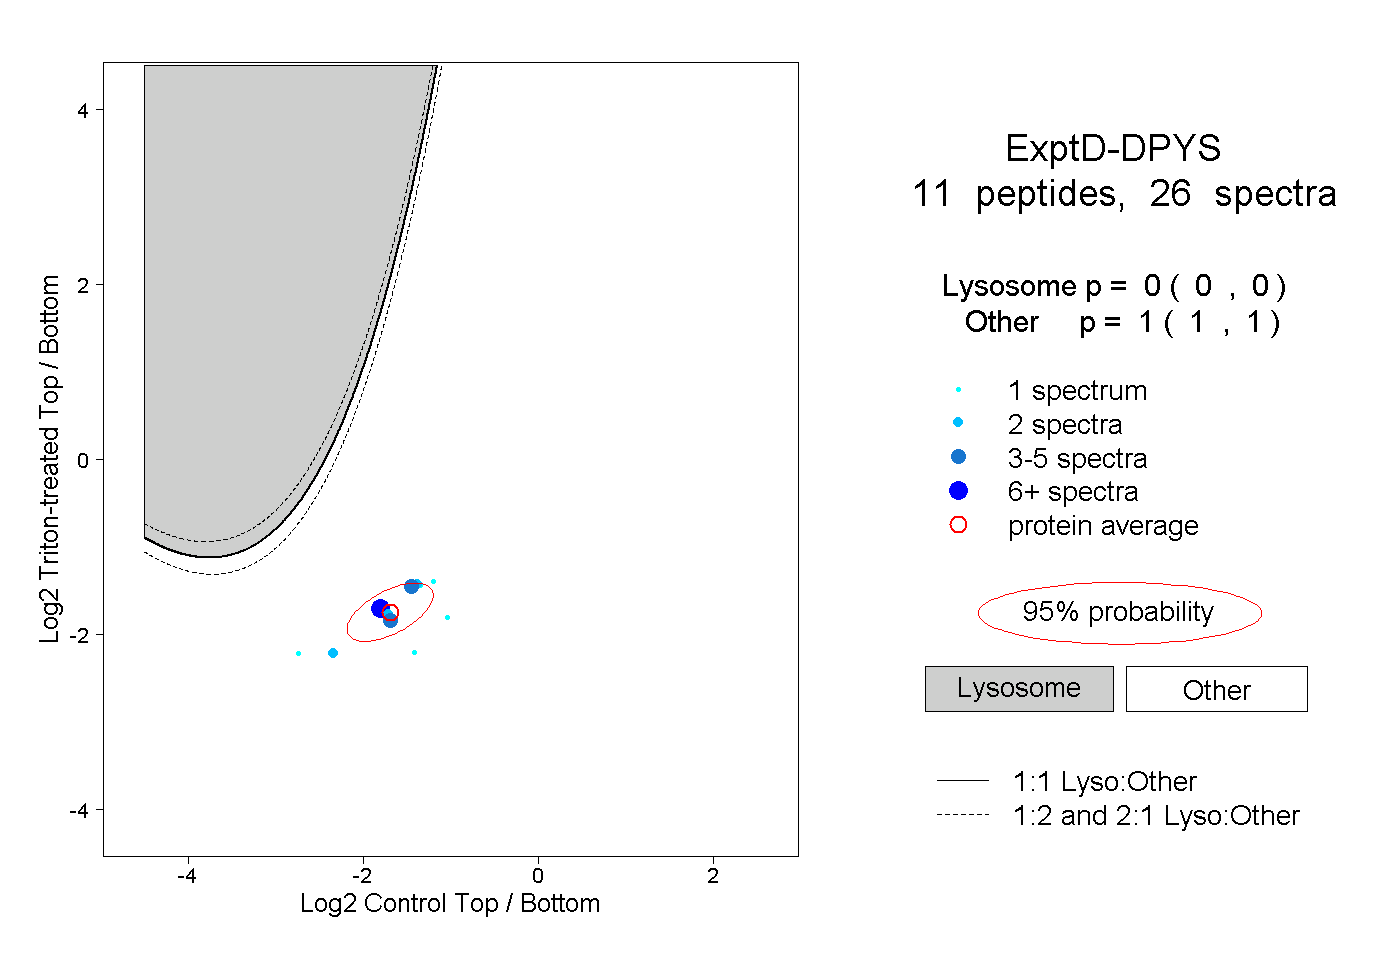 |
0.000 0.000 | 0.000 |
1.000 1.000 | 1.000 |