 11
11peptides
spectra
0.685 | 0.728
0.000 | 0.000
0.050 | 0.093
0.026 | 0.131
0.000 | 0.000
0.063 | 0.193
0.000 | 0.000
0.000 | 0.000
| Plot | Mito | Lyso | Perox | ER | Golgi | PM | Cytosol | Nucleus | |||||
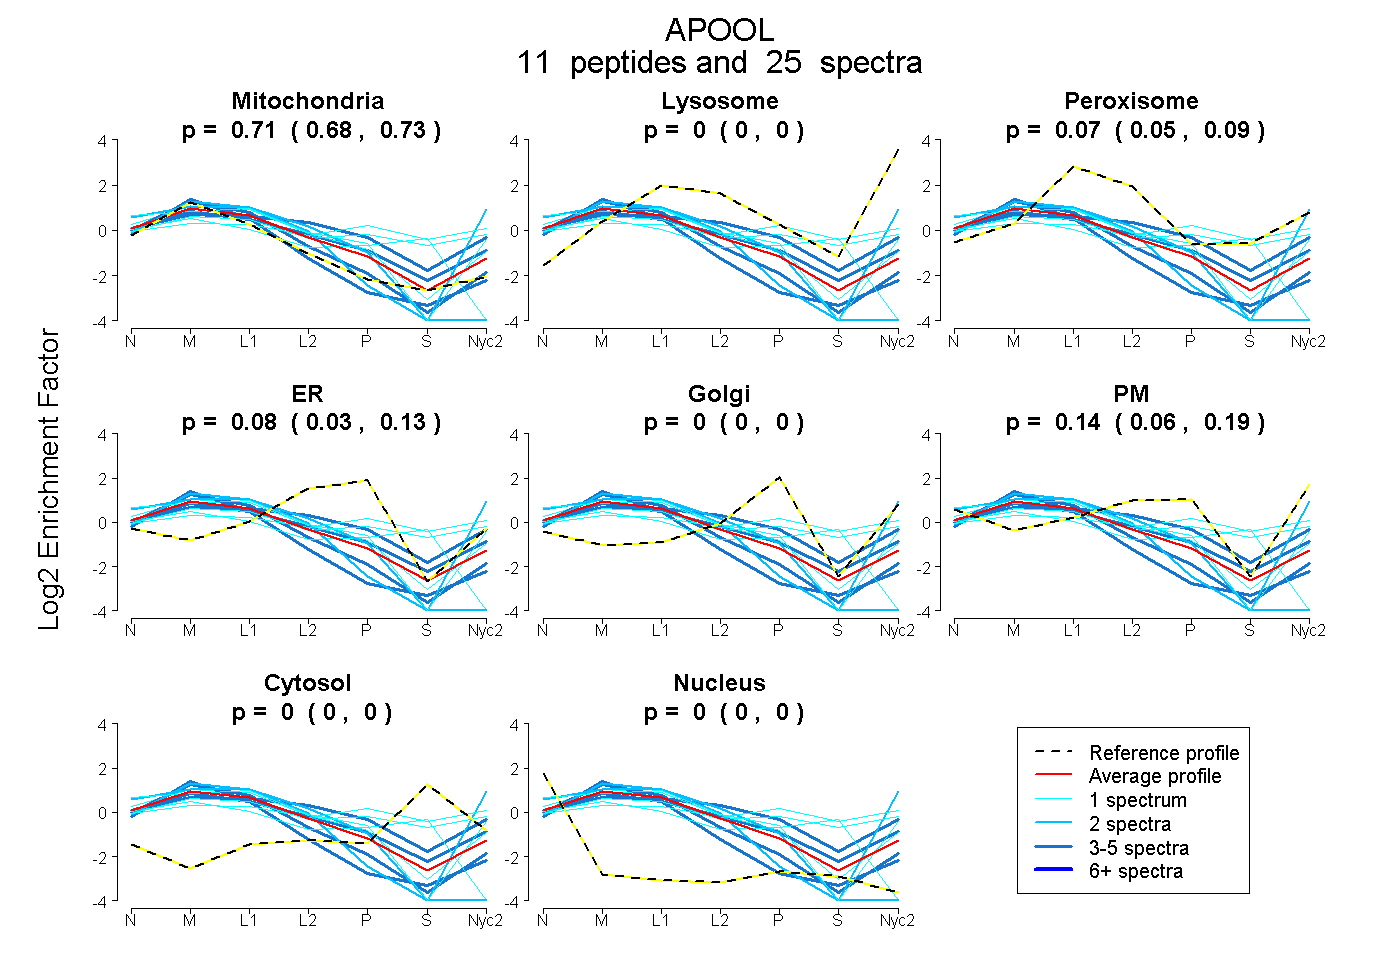
| Expt A |
11 peptides |
25 spectra |
|
0.708 0.685 | 0.728 |
0.000 0.000 | 0.000 |
0.073 0.050 | 0.093 |
0.082 0.026 | 0.131 |
0.000 0.000 | 0.000 |
0.136 0.063 | 0.193 |
0.000 0.000 | 0.000 |
0.000 0.000 | 0.000 |
| 1 spectrum, SMWTQSSEK | 0.305 | 0.000 | 0.295 | 0.000 | 0.173 | 0.070 | 0.157 | 0.000 | ||
| 4 spectra, AYATSHQIFQAIK | 0.408 | 0.000 | 0.232 | 0.062 | 0.081 | 0.216 | 0.001 | 0.000 | ||
| 1 spectrum, YVEEQPGYLQR | 0.556 | 0.000 | 0.000 | 0.000 | 0.000 | 0.444 | 0.000 | 0.000 | ||
| 1 spectrum, GFTSIR | 0.636 | 0.000 | 0.055 | 0.057 | 0.000 | 0.253 | 0.000 | 0.000 | ||
| 1 spectrum, TTTAYYIGWCK | 0.175 | 0.000 | 0.276 | 0.000 | 0.213 | 0.122 | 0.215 | 0.000 | ||
| 3 spectra, DAYVYLK | 1.000 | 0.000 | 0.000 | 0.000 | 0.000 | 0.000 | 0.000 | 0.000 | ||
| 5 spectra, EGRPDEIHAK | 0.614 | 0.000 | 0.101 | 0.056 | 0.000 | 0.230 | 0.000 | 0.000 | ||
| 2 spectra, TPDLEHSVFLLK | 0.963 | 0.000 | 0.000 | 0.000 | 0.000 | 0.000 | 0.000 | 0.037 | ||
| 2 spectra, QLVRPEQLPIYTAPPLHSK | 0.481 | 0.217 | 0.000 | 0.000 | 0.000 | 0.302 | 0.000 | 0.000 | ||
| 4 spectra, GIYLFMK | 0.928 | 0.000 | 0.000 | 0.035 | 0.000 | 0.037 | 0.000 | 0.000 | ||
| 1 spectrum, MGVITASGLAGLLSAR | 0.647 | 0.000 | 0.000 | 0.056 | 0.000 | 0.000 | 0.258 | 0.039 |
| Plot | Mito | Lyso or Perox | ER | Golgi | PM | Cytosol | Nucleus | ||||||
| Expt B |
6 peptides |
13 spectra |
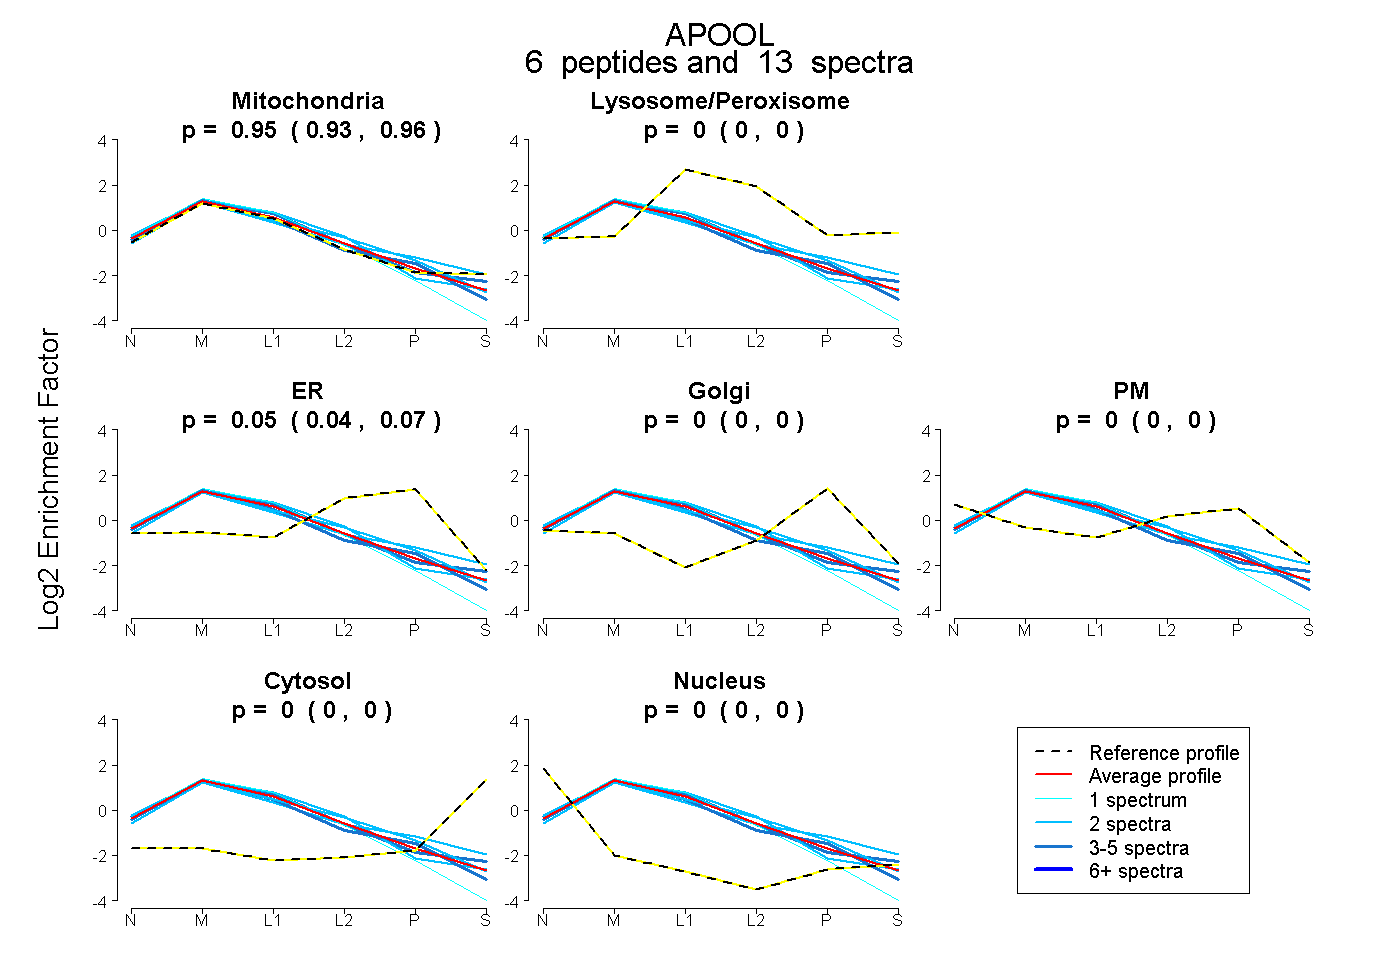 |
0.947 0.928 | 0.961 |
0.000 0.000 | 0.000 |
0.053 0.036 | 0.068 |
0.000 0.000 | 0.000 |
0.000 0.000 | 0.000 |
0.000 0.000 | 0.000 |
0.000 0.000 | 0.000 |
|||
| Plot | Lyso | Other | |||||||||||
| Expt C |
15 peptides |
104 spectra |
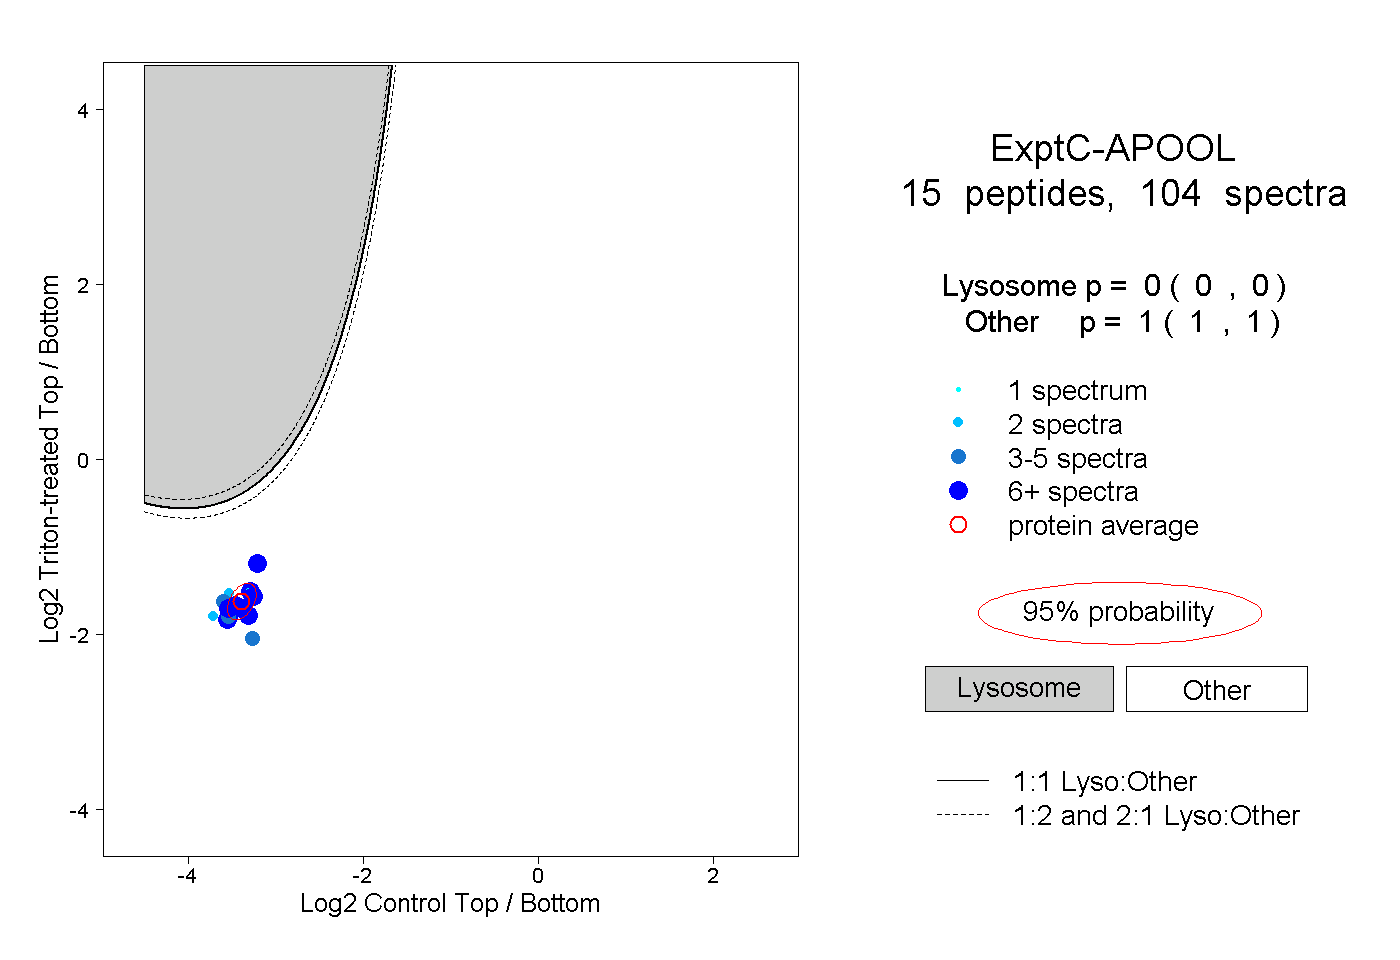 |
0.000 0.000 | 0.000 |
1.000 1.000 | 1.000 |
||||||||
| Plot | Lyso | Other | |||||||||||
| Expt D |
4 peptides |
7 spectra |
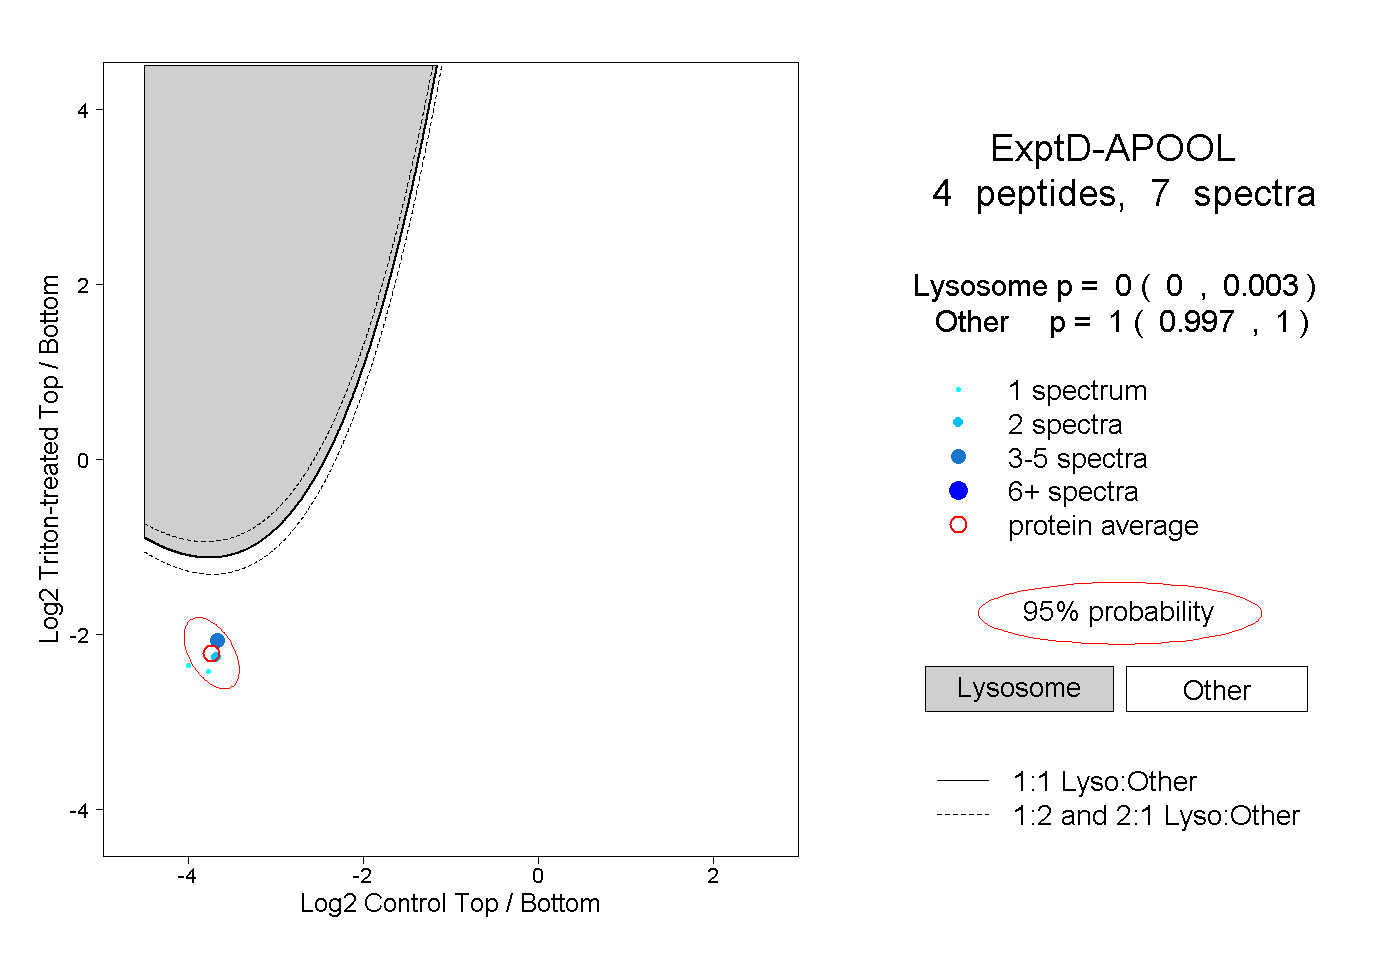 |
0.000 0.000 | 0.003 |
1.000 0.997 | 1.000 |