 11
11peptides
spectra
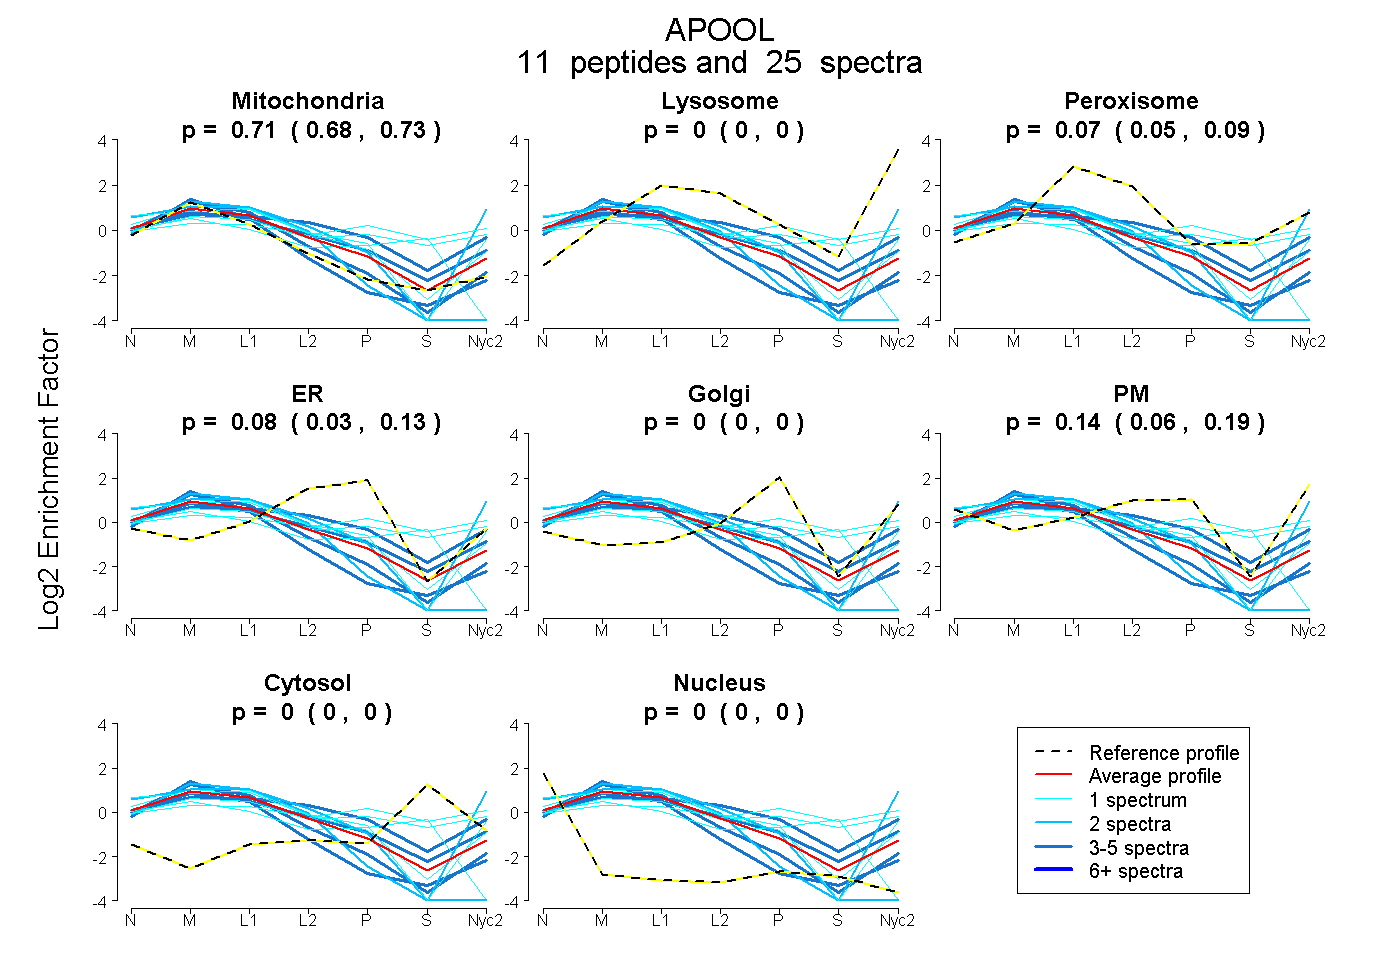
0.685 | 0.728
0.000 | 0.000
0.050 | 0.093
0.026 | 0.131
0.000 | 0.000
0.063 | 0.193
0.000 | 0.000
0.000 | 0.000
6peptides
spectra
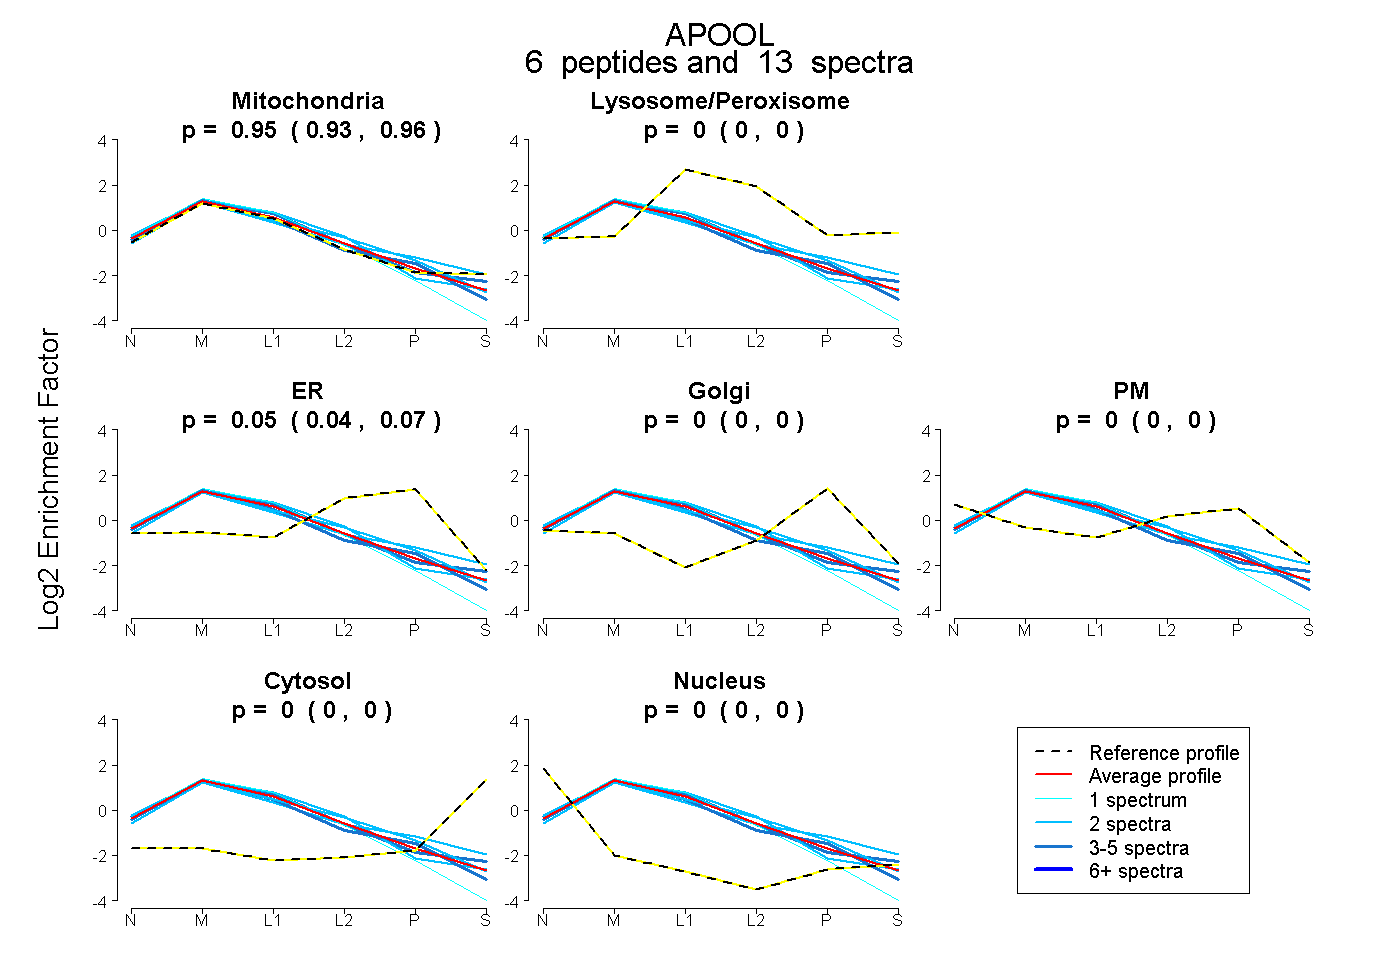
0.928 | 0.961
0.000 | 0.000
0.036 | 0.068
0.000 | 0.000
0.000 | 0.000
0.000 | 0.000
0.000 | 0.000
15peptides
spectra
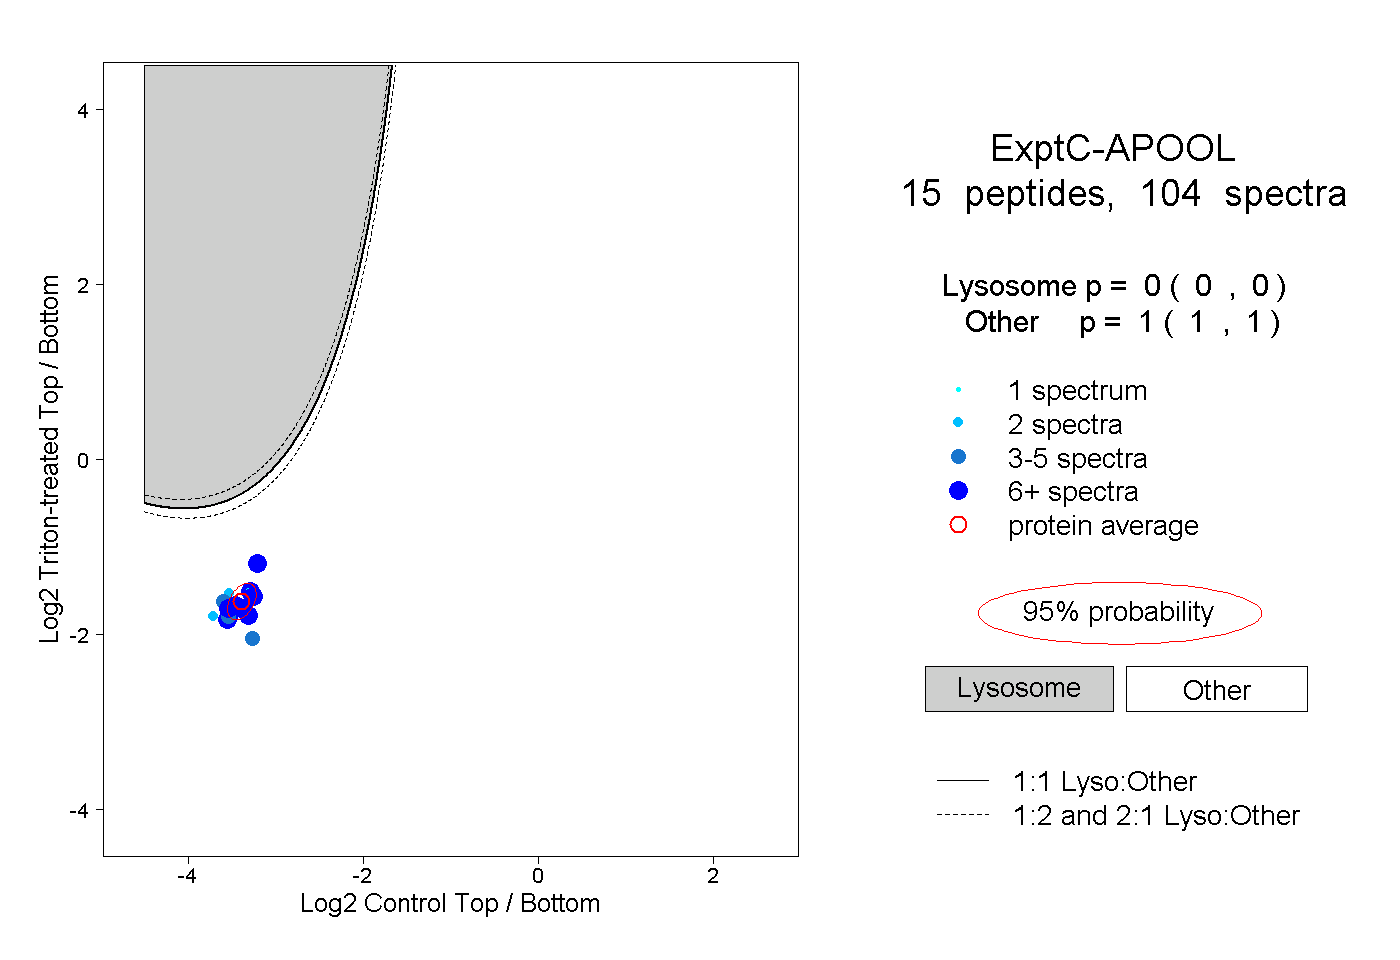
0.000 | 0.000
1.000 | 1.000
4peptides
spectra
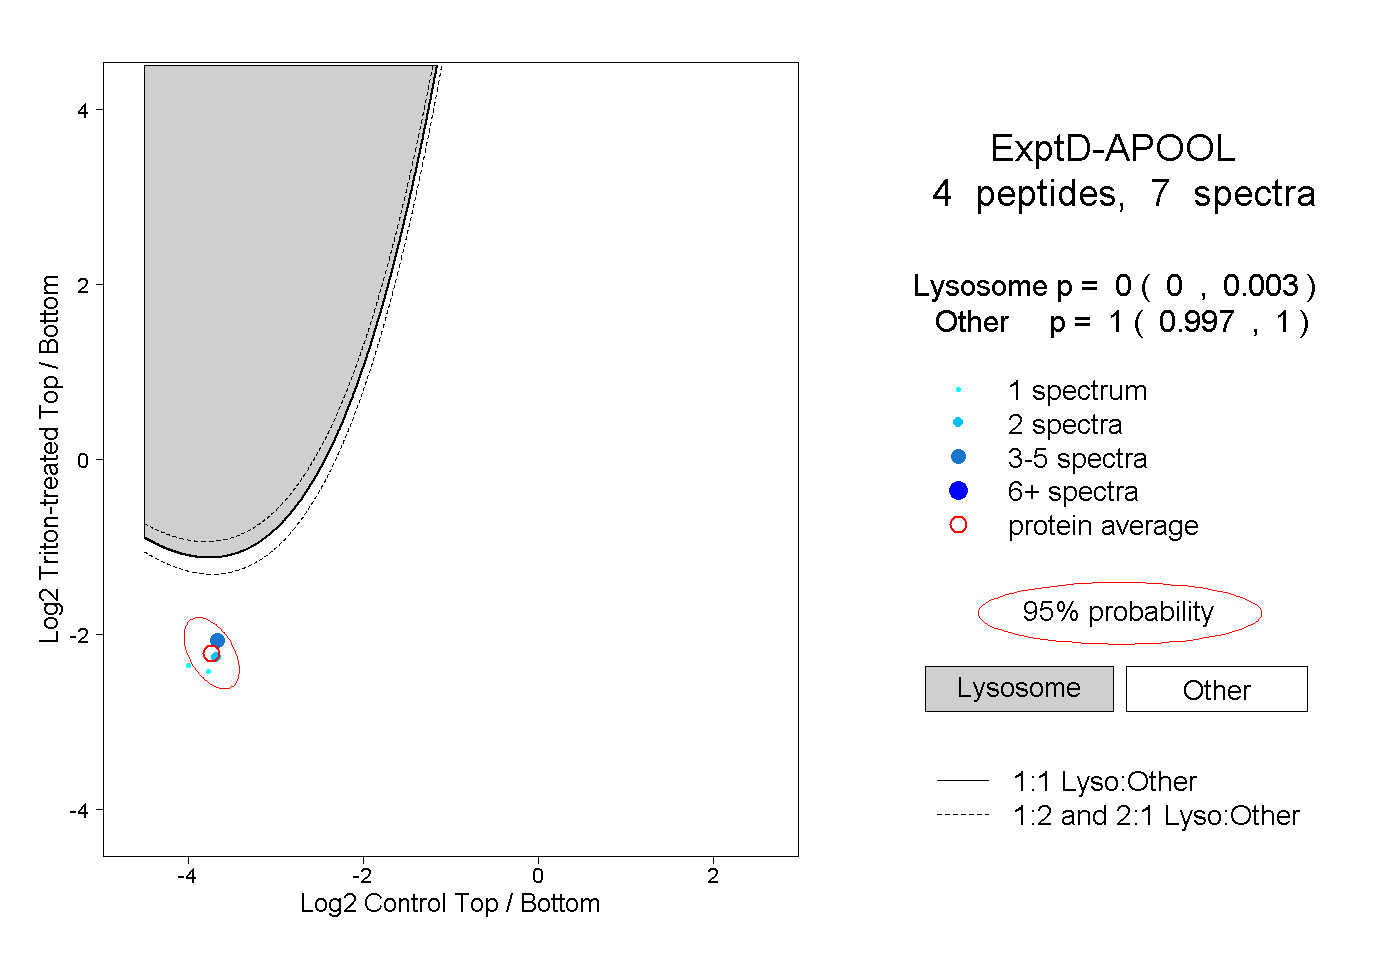
0.000 | 0.003
0.997 | 1.000