 73
73peptides
spectra
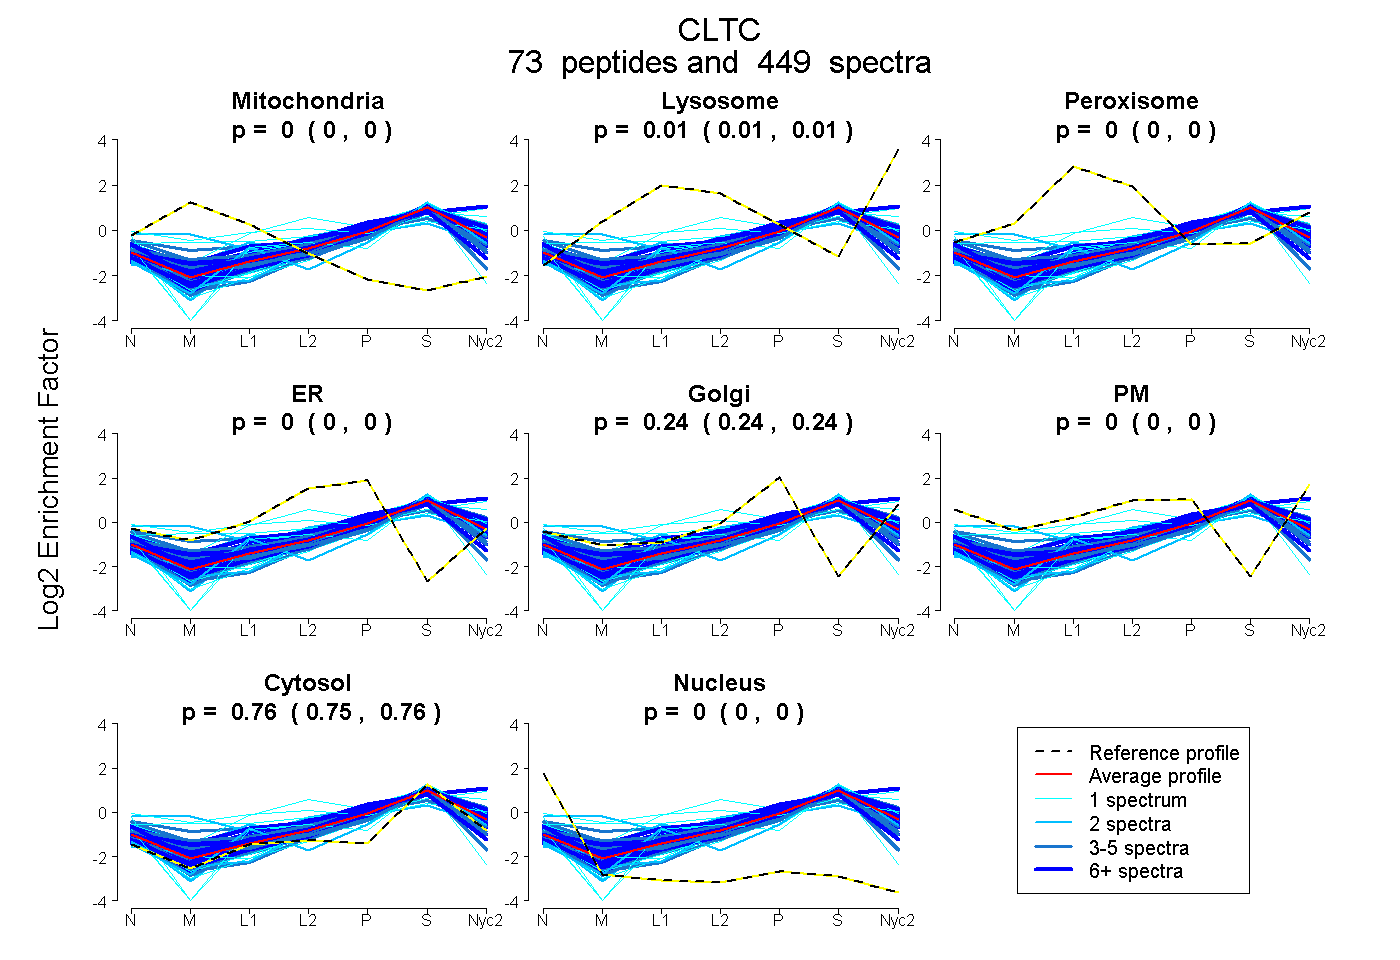
0.000 | 0.000
0.005 | 0.006
0.000 | 0.000
0.000 | 0.000
0.238 | 0.239
0.000 | 0.000
0.755 | 0.756
0.000 | 0.000
53peptides
spectra
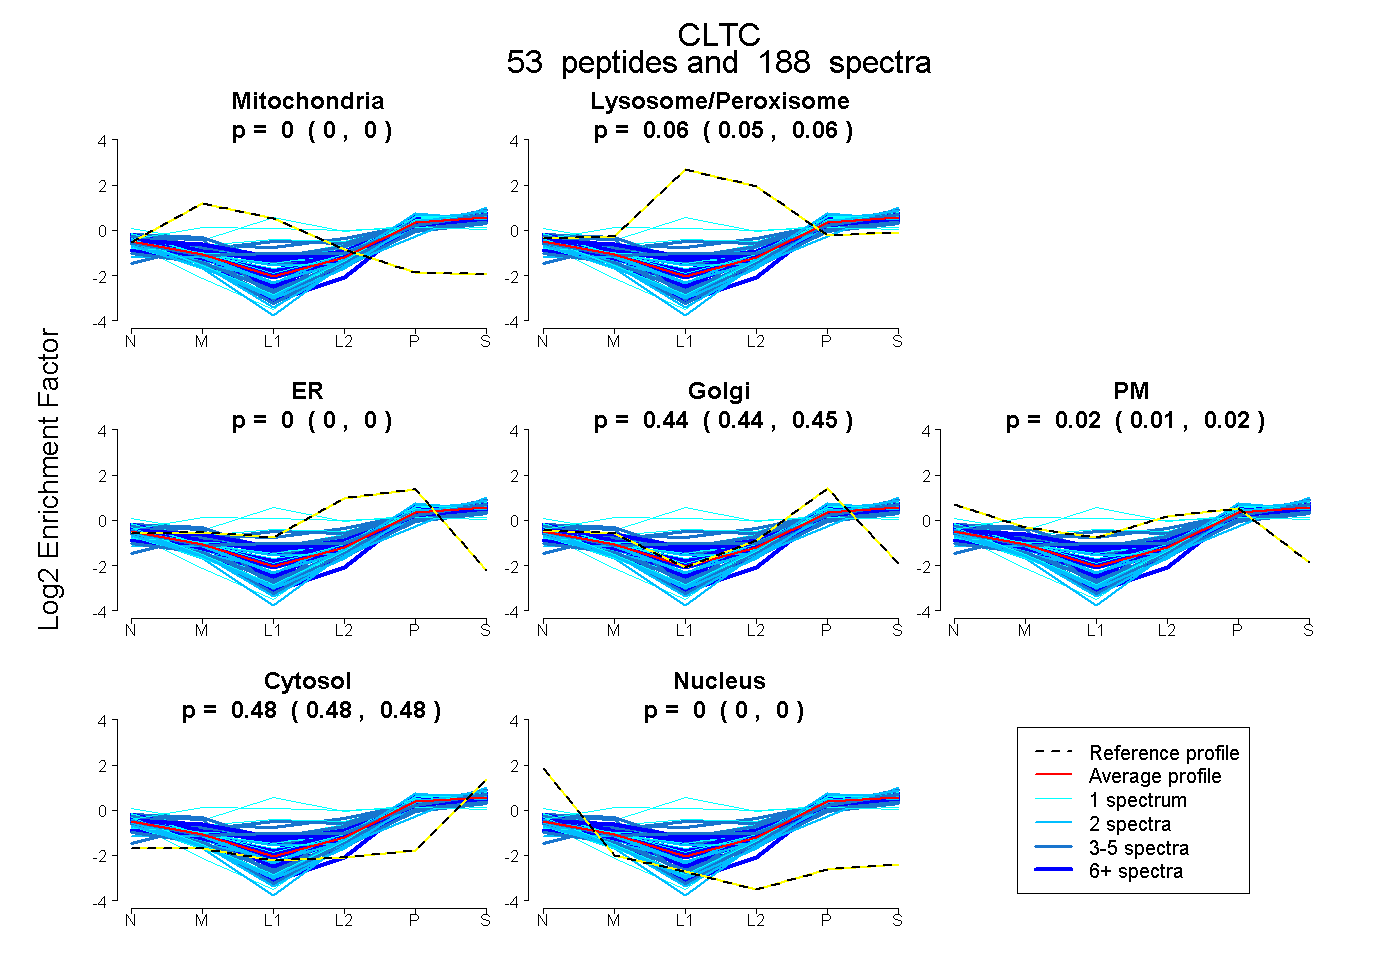
0.000 | 0.000
0.052 | 0.058
0.000 | 0.000
0.441 | 0.447
0.012 | 0.020
0.483 | 0.485
0.000 | 0.000
60peptides
spectra
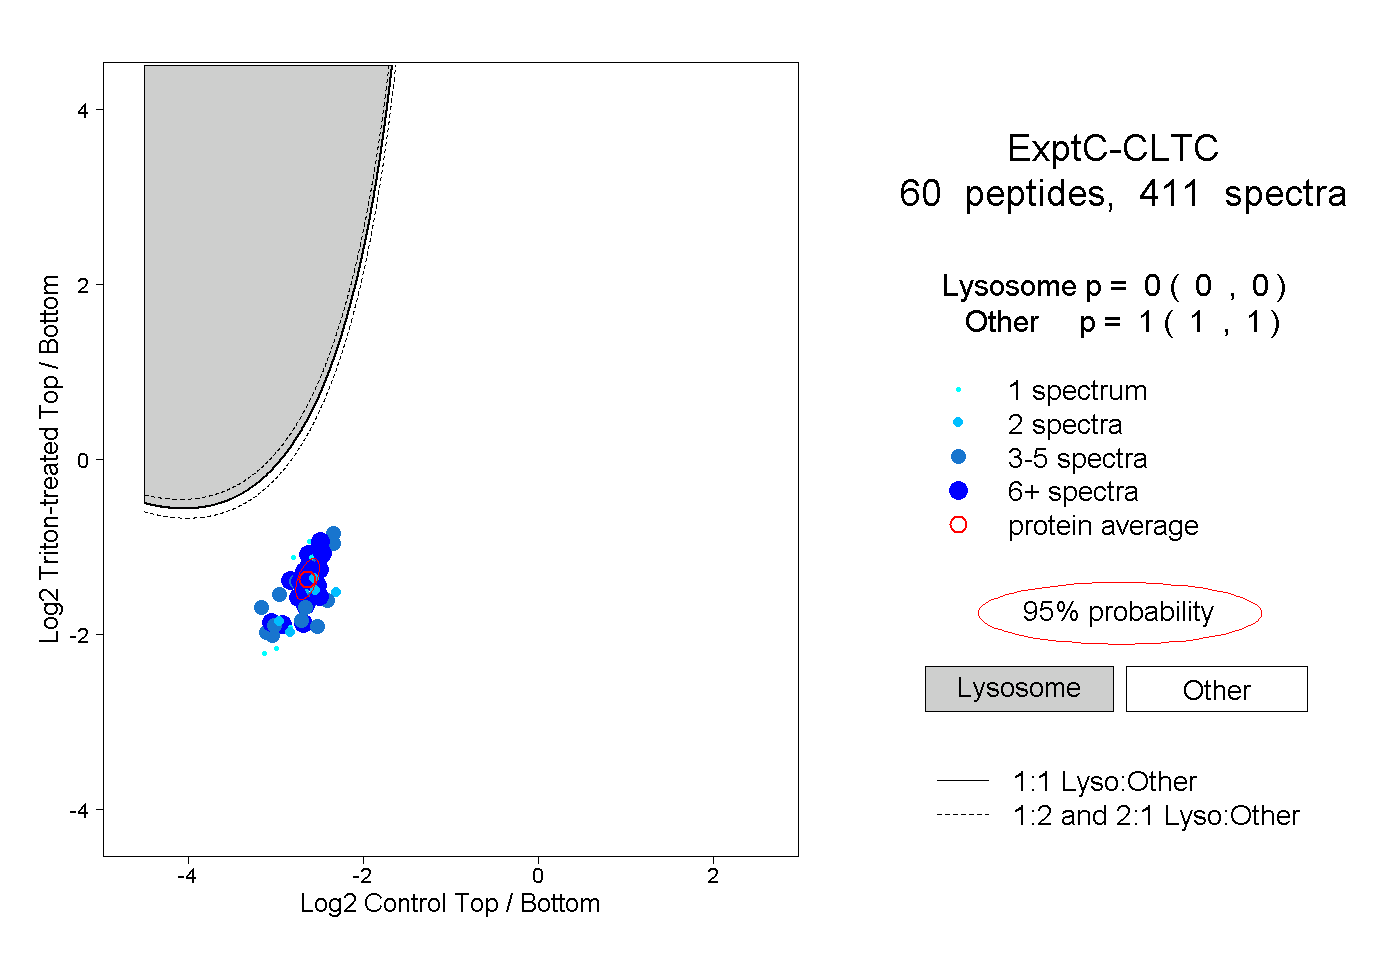
0.000 | 0.000
1.000 | 1.000
18peptides
spectra
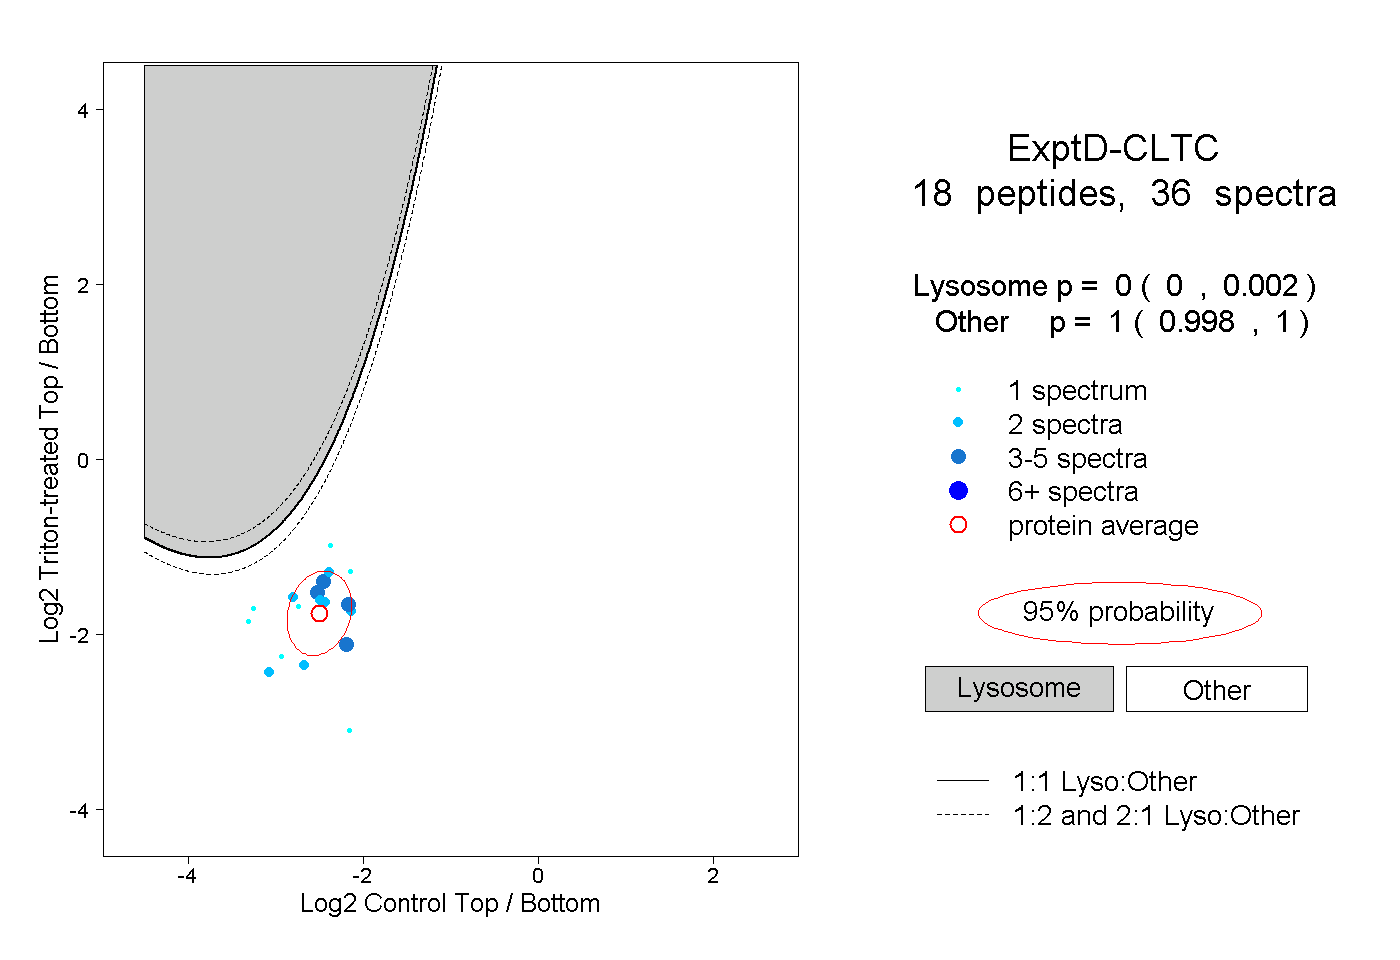
0.000 | 0.002
0.998 | 1.000