 7
7peptides
spectra
0.000 | 0.000
0.524 | 0.583
0.000 | 0.028
0.000 | 0.046
0.000 | 0.019
0.333 | 0.400
0.030 | 0.063
0.000 | 0.000
9peptides
spectra
0.000 | 0.000
1.000 | 1.000
| Plot | Mito | Lyso | Perox | ER | Golgi | PM | Cytosol | Nucleus | |||||
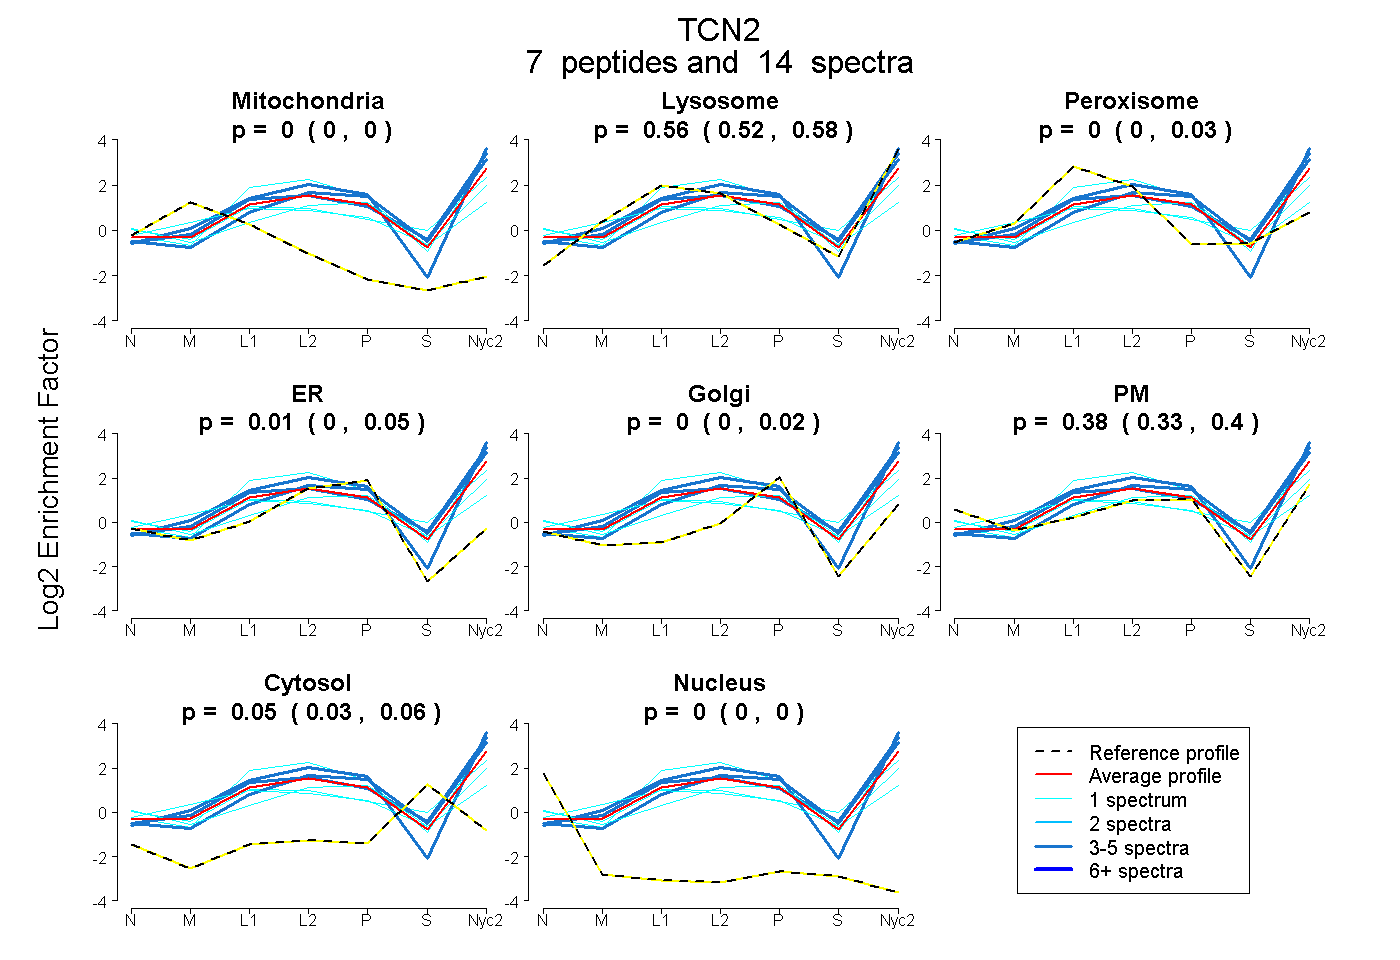
| Expt A |
7 peptides |
14 spectra |
|
0.000 0.000 | 0.000 |
0.560 0.524 | 0.583 |
0.000 0.000 | 0.028 |
0.011 0.000 | 0.046 |
0.000 0.000 | 0.019 |
0.379 0.333 | 0.400 |
0.050 0.030 | 0.063 |
0.000 0.000 | 0.000 |
||
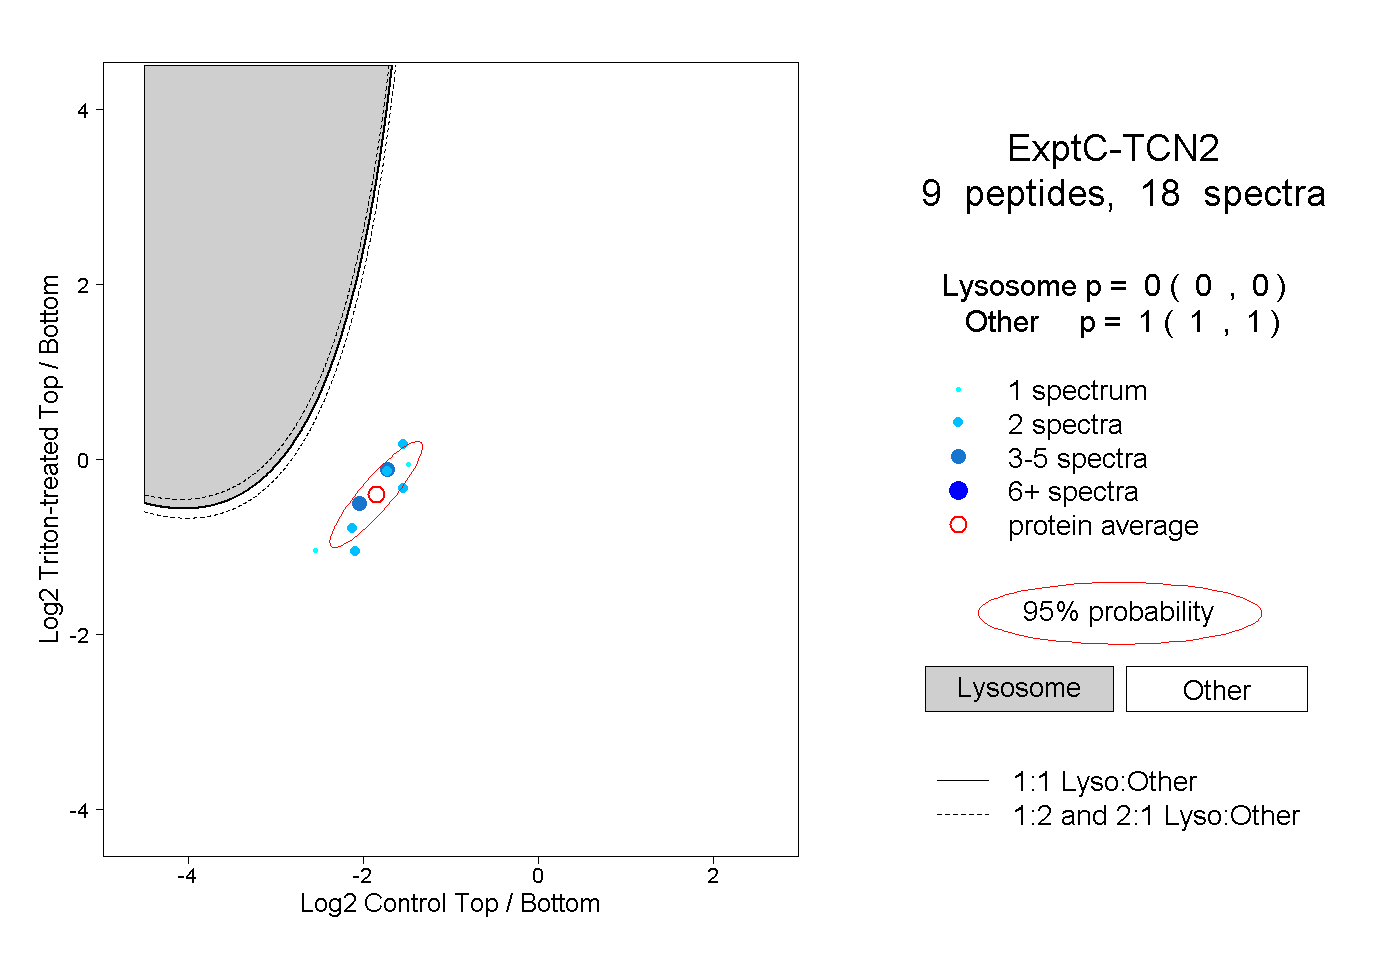
| Plot | Lyso | Other | |||||||||||
| Expt C |
9 peptides |
18 spectra |
|
0.000 0.000 | 0.000 |
1.000 1.000 | 1.000 |