10
10peptides
spectra
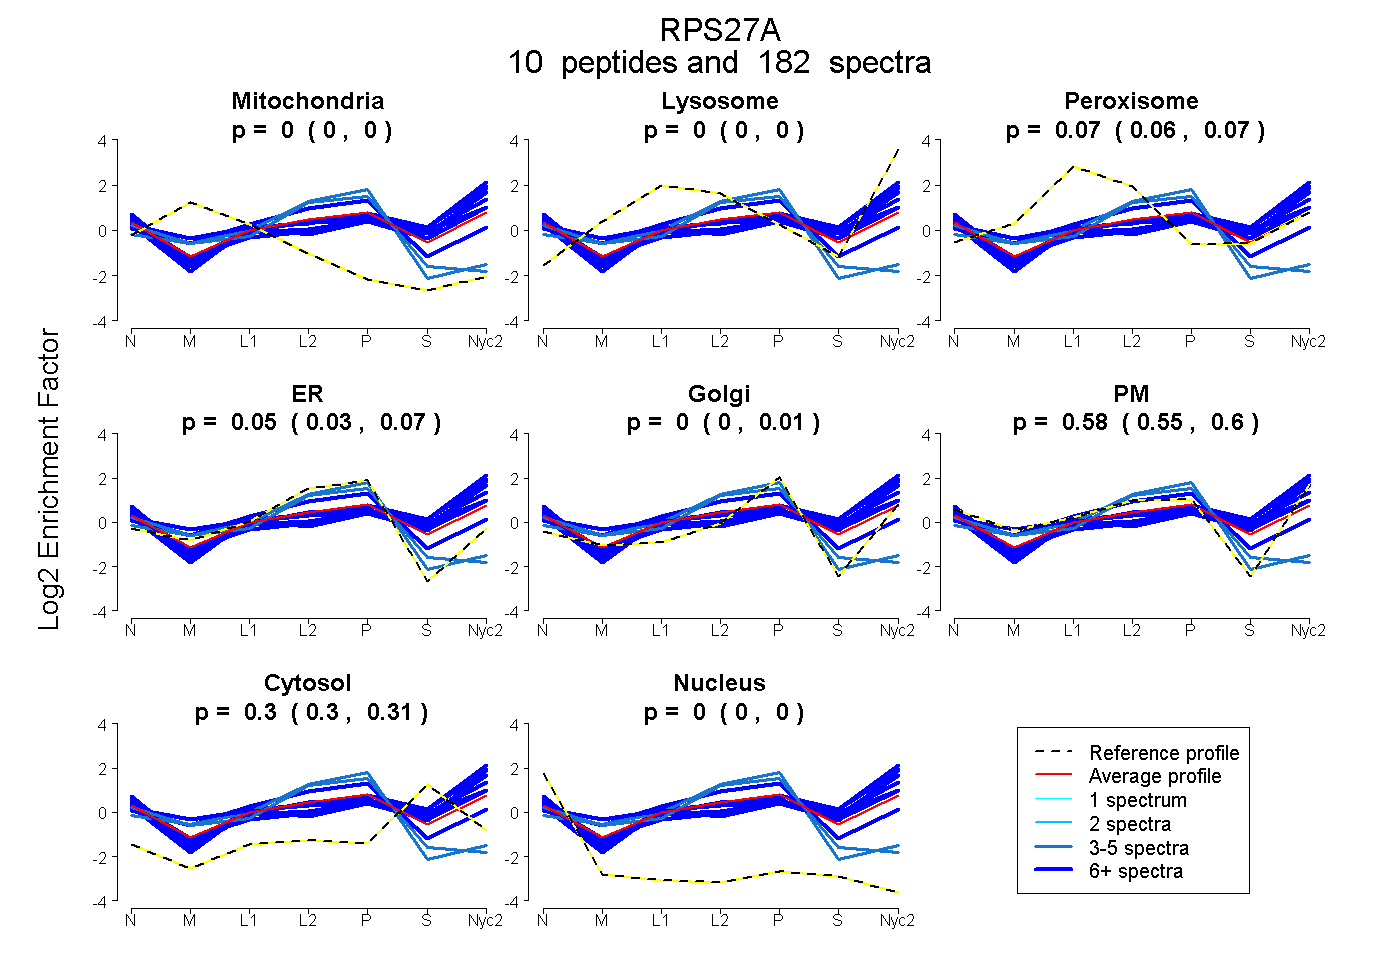
0.000 | 0.000
0.000 | 0.000
0.064 | 0.073
0.027 | 0.067
0.000 | 0.006
0.553 | 0.595
0.300 | 0.308
0.000 | 0.000
8peptides
spectra
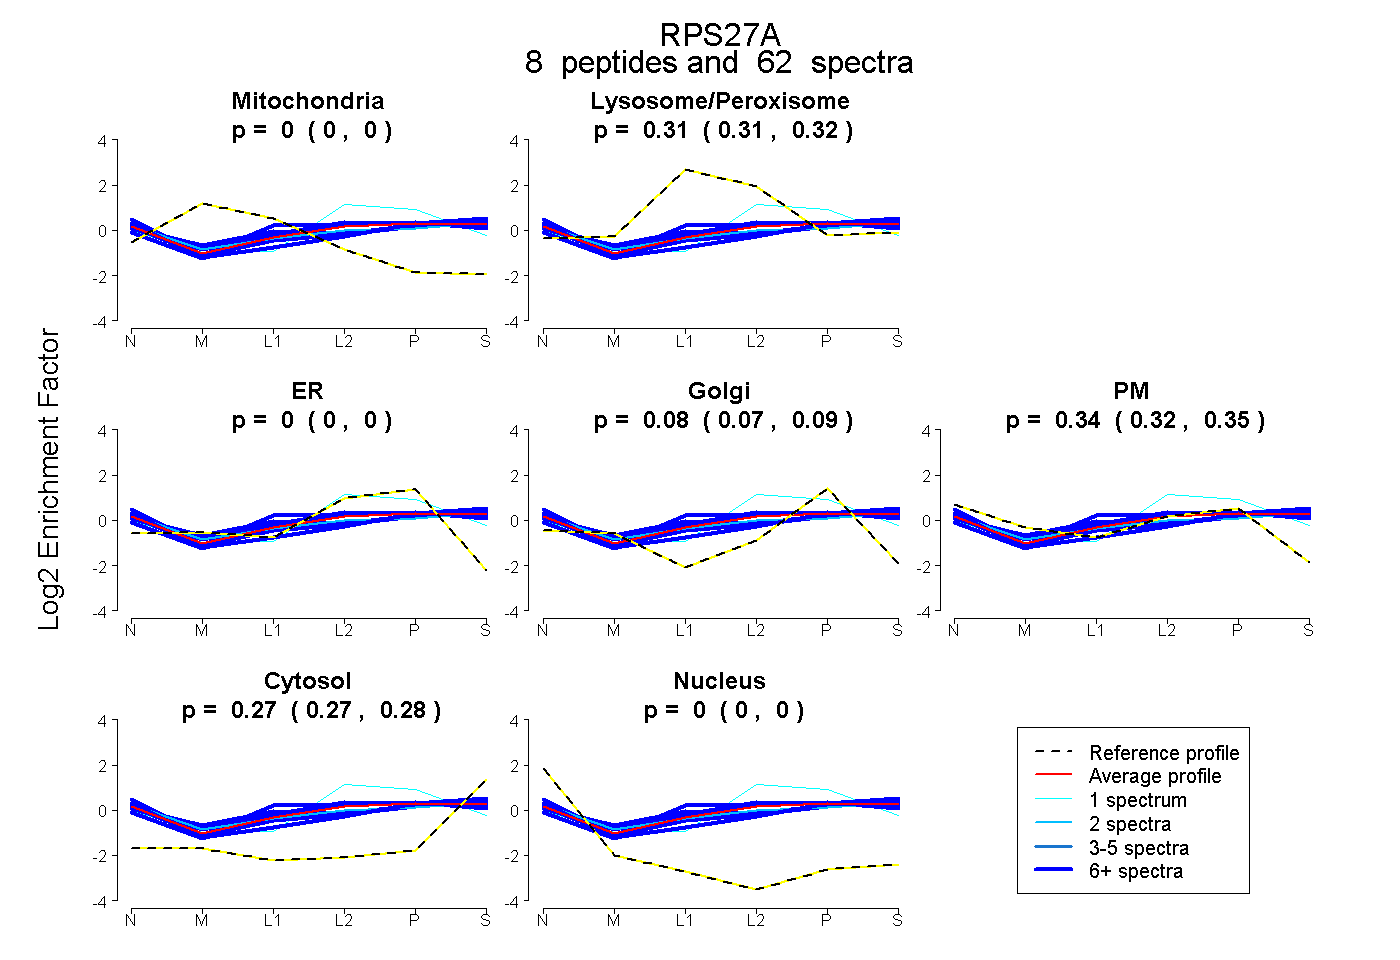
0.000 | 0.000
0.306 | 0.320
0.000 | 0.000
0.067 | 0.086
0.324 | 0.347
0.268 | 0.275
0.000 | 0.000
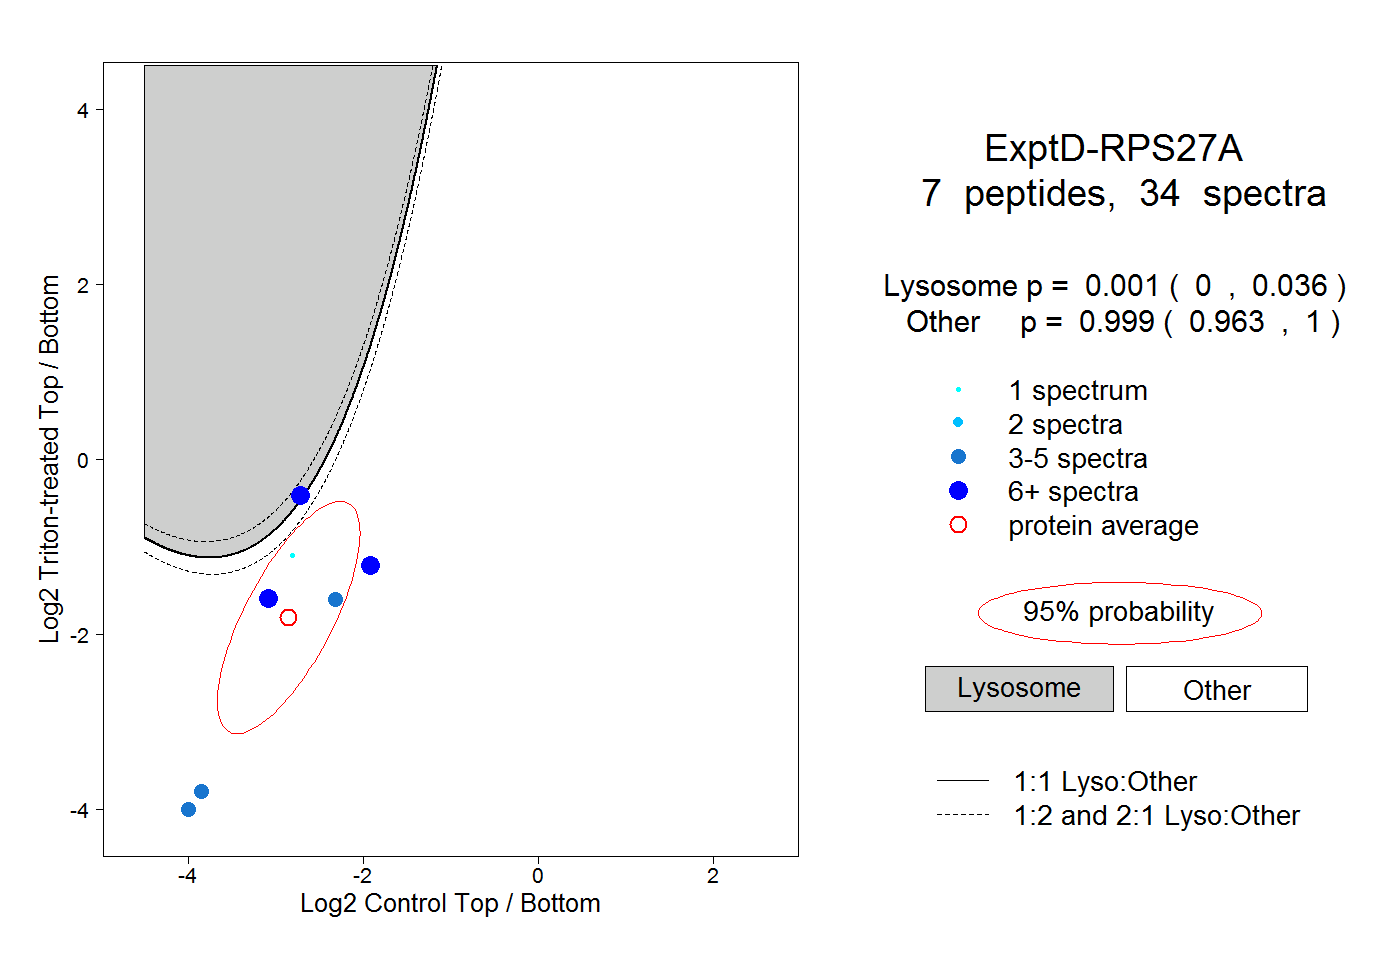
11peptides
spectra
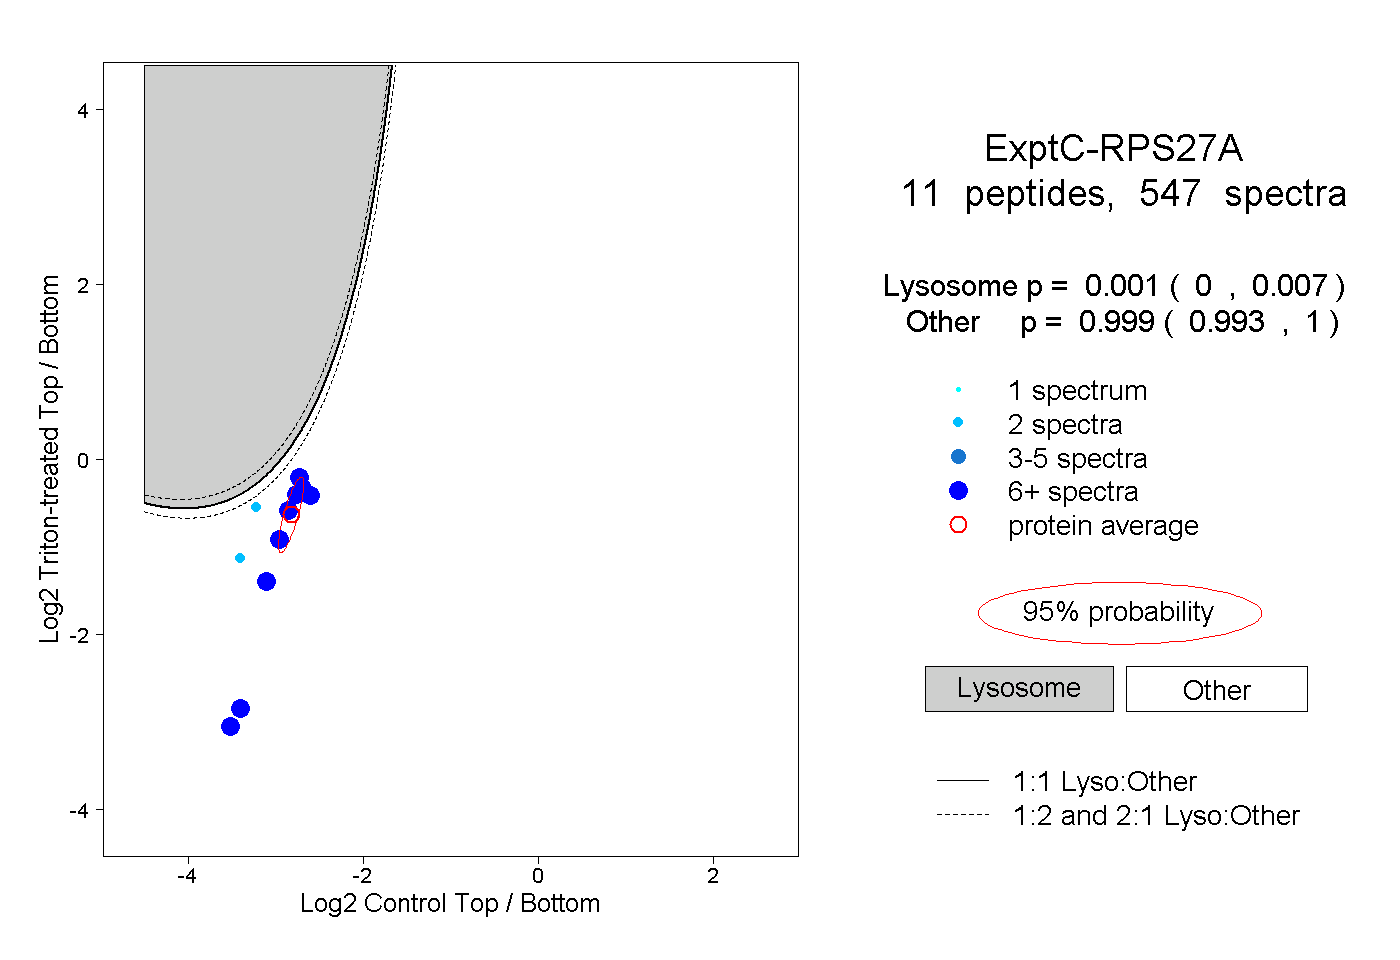
0.000 | 0.007
0.993 | 1.000