 10
10peptides
spectra
0.000 | 0.000
0.000 | 0.000
0.064 | 0.073
0.027 | 0.067
0.000 | 0.006
0.553 | 0.595
0.300 | 0.308
0.000 | 0.000
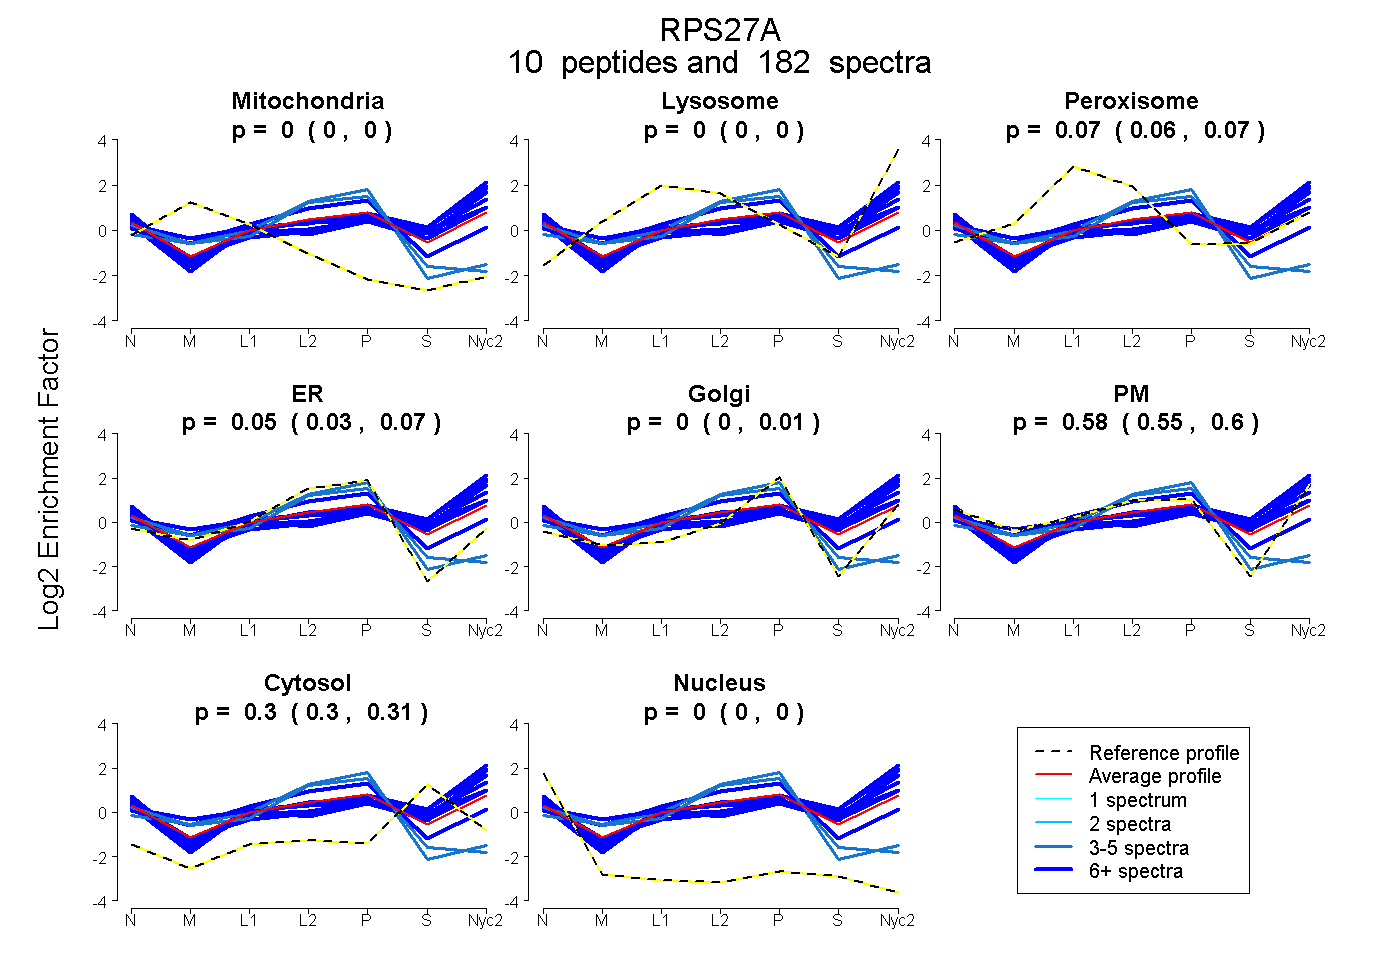
| Plot | Mito | Lyso | Perox | ER | Golgi | PM | Cytosol | Nucleus | |||||
| Expt A |
10 peptides |
182 spectra |
|
0.000 0.000 | 0.000 |
0.000 0.000 | 0.000 |
0.069 0.064 | 0.073 |
0.050 0.027 | 0.067 |
0.000 0.000 | 0.006 |
0.577 0.553 | 0.595 |
0.305 0.300 | 0.308 |
0.000 0.000 | 0.000 |
| 38 spectra, MQIFVK | 0.000 | 0.225 | 0.000 | 0.000 | 0.000 | 0.430 | 0.345 | 0.000 | ||
| 6 spectra, TITLEVEPSDTIENVK | 0.001 | 0.049 | 0.105 | 0.000 | 0.000 | 0.519 | 0.326 | 0.000 | ||
| 5 spectra, SYTTPK | 0.074 | 0.000 | 0.000 | 0.869 | 0.000 | 0.000 | 0.019 | 0.038 | ||
| 18 spectra, TLSDYNIQK | 0.000 | 0.073 | 0.000 | 0.000 | 0.000 | 0.540 | 0.387 | 0.000 | ||
| 30 spectra, ESTLHLVLR | 0.000 | 0.021 | 0.007 | 0.000 | 0.000 | 0.561 | 0.411 | 0.000 | ||
| 4 spectra, VDENGK | 0.065 | 0.000 | 0.000 | 0.788 | 0.000 | 0.000 | 0.076 | 0.071 | ||
| 14 spectra, ECPSDECGAGVFMGSHFDR | 0.000 | 0.000 | 0.185 | 0.425 | 0.110 | 0.147 | 0.133 | 0.000 | ||
| 13 spectra, QLEDGR | 0.000 | 0.133 | 0.000 | 0.000 | 0.000 | 0.539 | 0.328 | 0.000 | ||
| 38 spectra, EGIPPDQQR | 0.000 | 0.178 | 0.000 | 0.000 | 0.000 | 0.468 | 0.354 | 0.000 | ||
| 16 spectra, LIFAGK | 0.000 | 0.107 | 0.000 | 0.000 | 0.000 | 0.613 | 0.280 | 0.000 |
| Plot | Mito | Lyso or Perox | ER | Golgi | PM | Cytosol | Nucleus | ||||||
| Expt B |
8 peptides |
62 spectra |
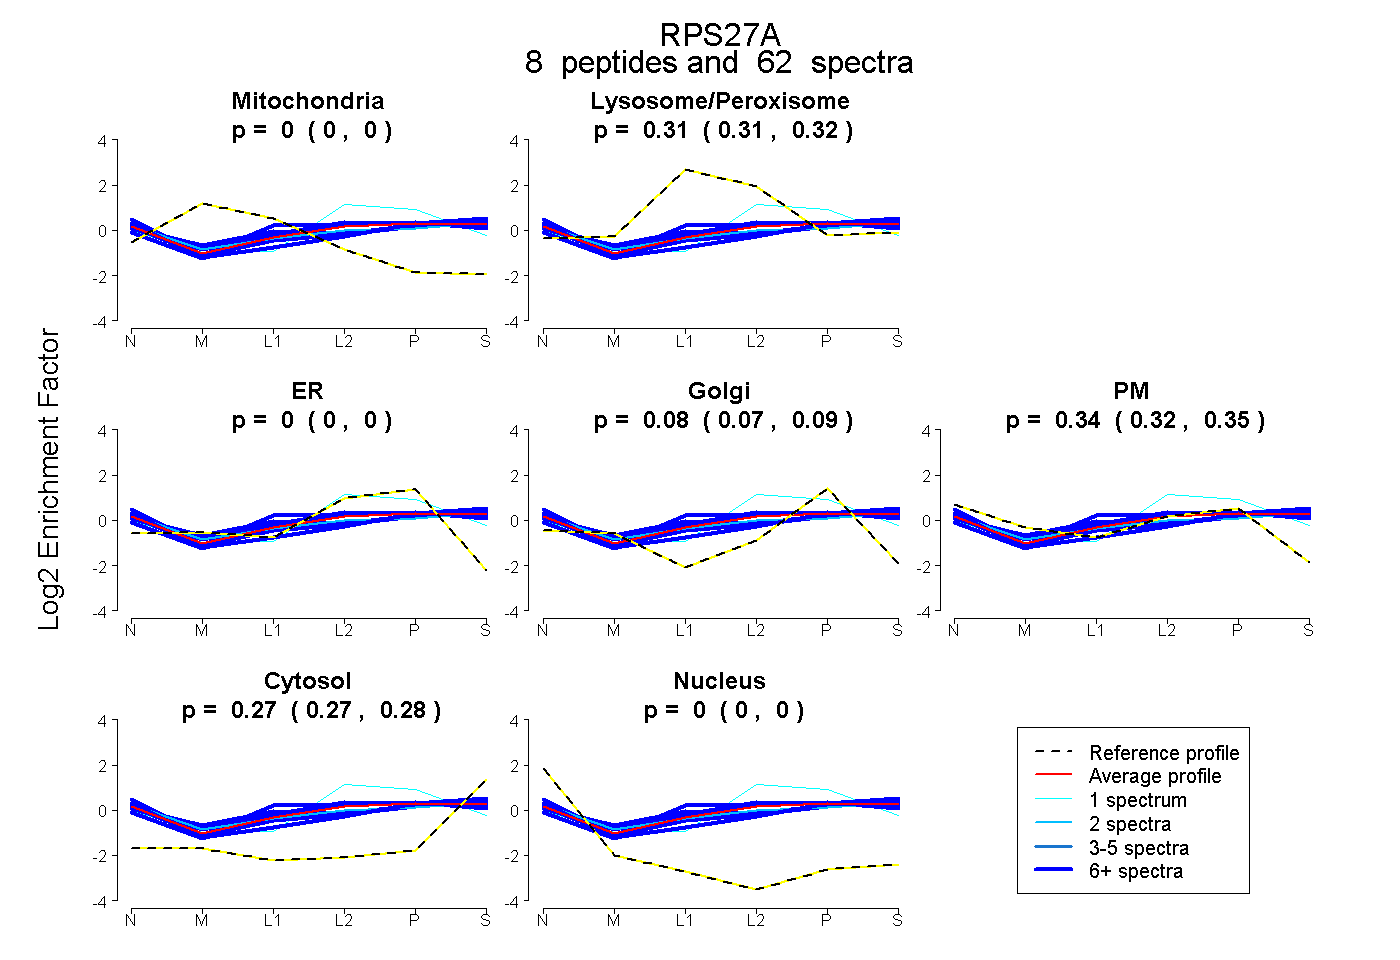 |
0.000 0.000 | 0.000 |
0.314 0.306 | 0.320 |
0.000 0.000 | 0.000 |
0.078 0.067 | 0.086 |
0.337 0.324 | 0.347 |
0.272 0.268 | 0.275 |
0.000 0.000 | 0.000 |
|||
| Plot | Lyso | Other | |||||||||||
| Expt C |
11 peptides |
547 spectra |
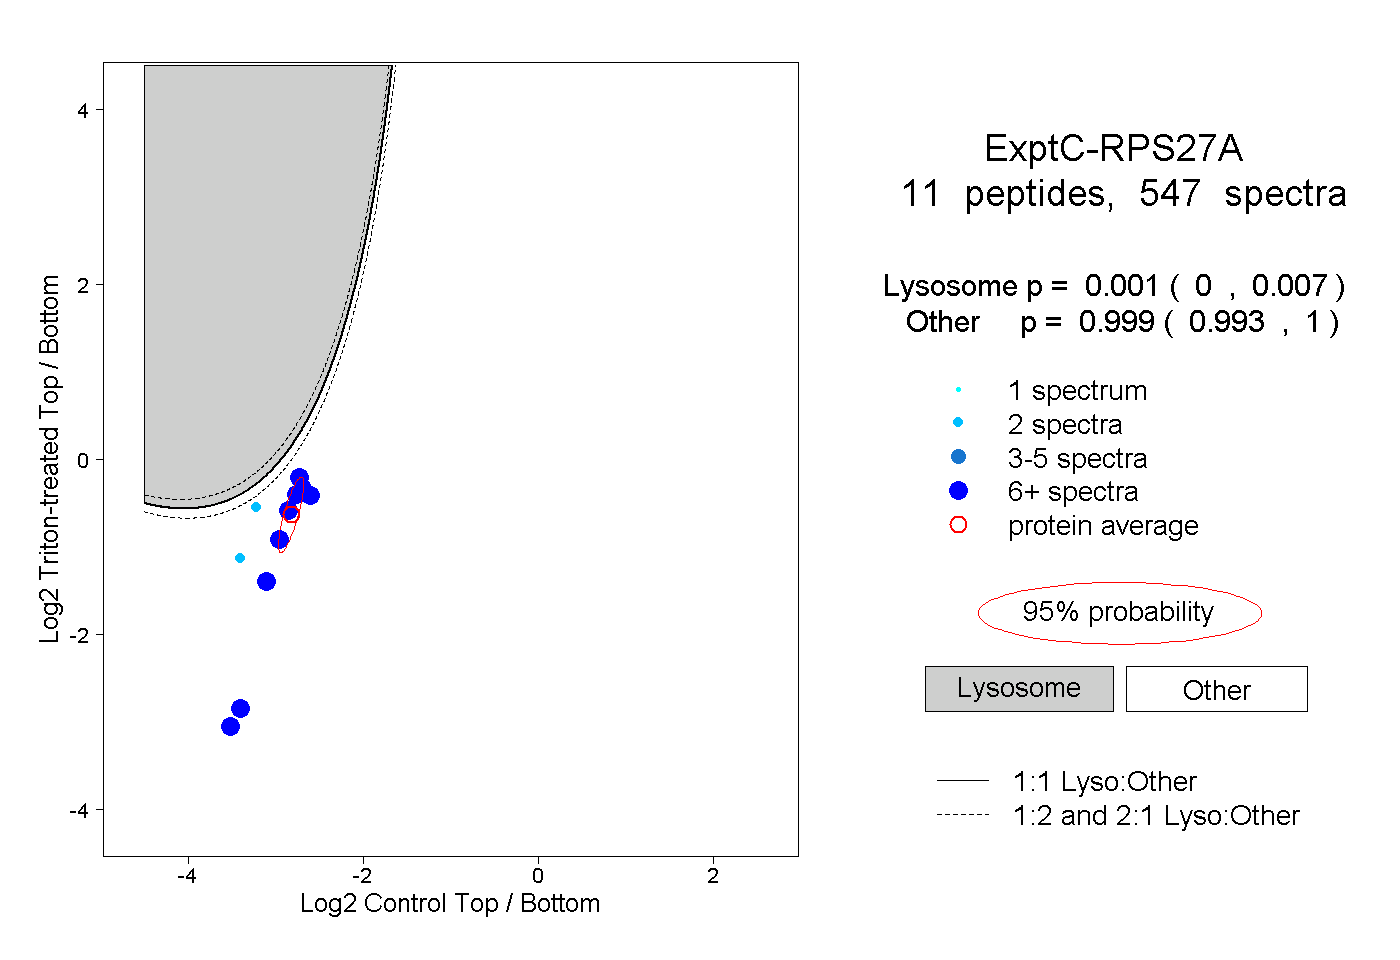 |
0.001 0.000 | 0.007 |
0.999 0.993 | 1.000 |
||||||||
| Plot | Lyso | Other | |||||||||||
| Expt D |
7 peptides |
34 spectra |
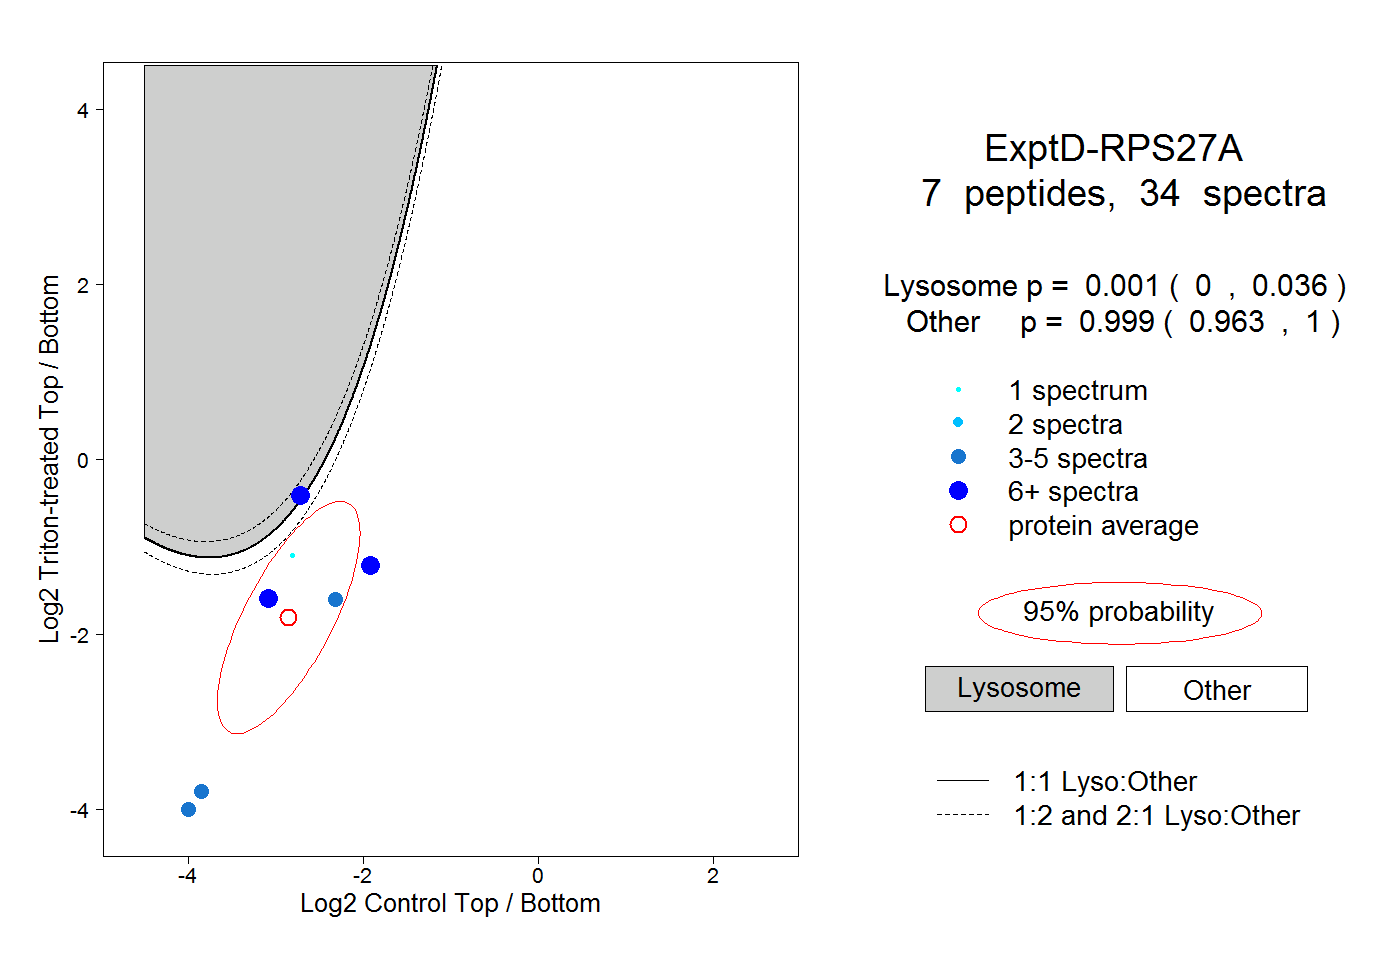 |
0.001 0.000 | 0.036 |
0.999 0.963 | 1.000 |