2
2peptides
spectra
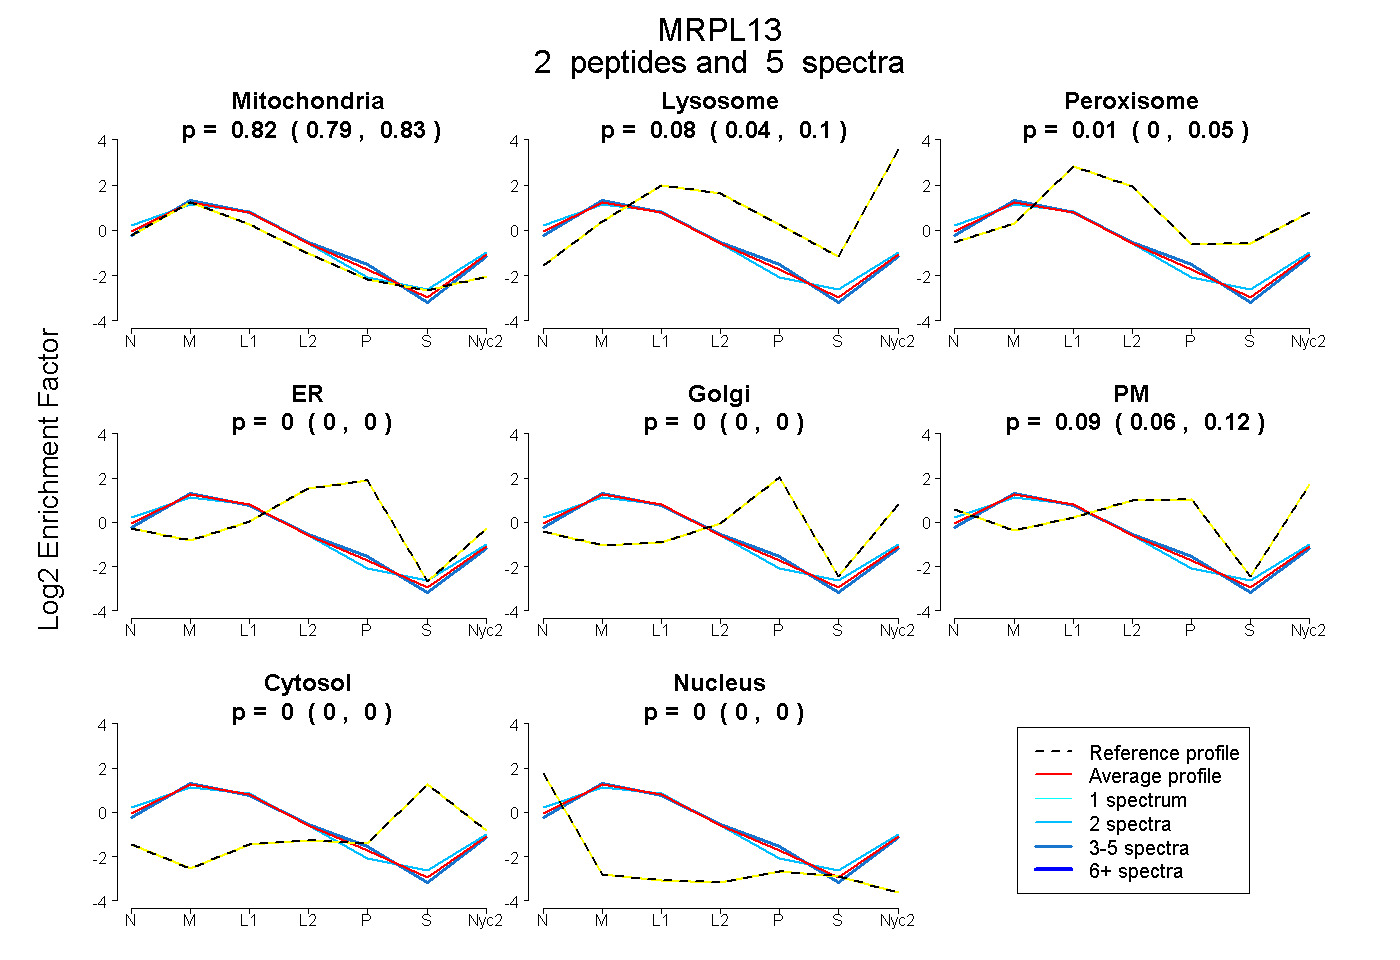
0.794 | 0.831
0.045 | 0.103
0.000 | 0.047
0.000 | 0.000
0.000 | 0.000
0.057 | 0.121
0.000 | 0.000
0.000 | 0.000
2peptides
spectra
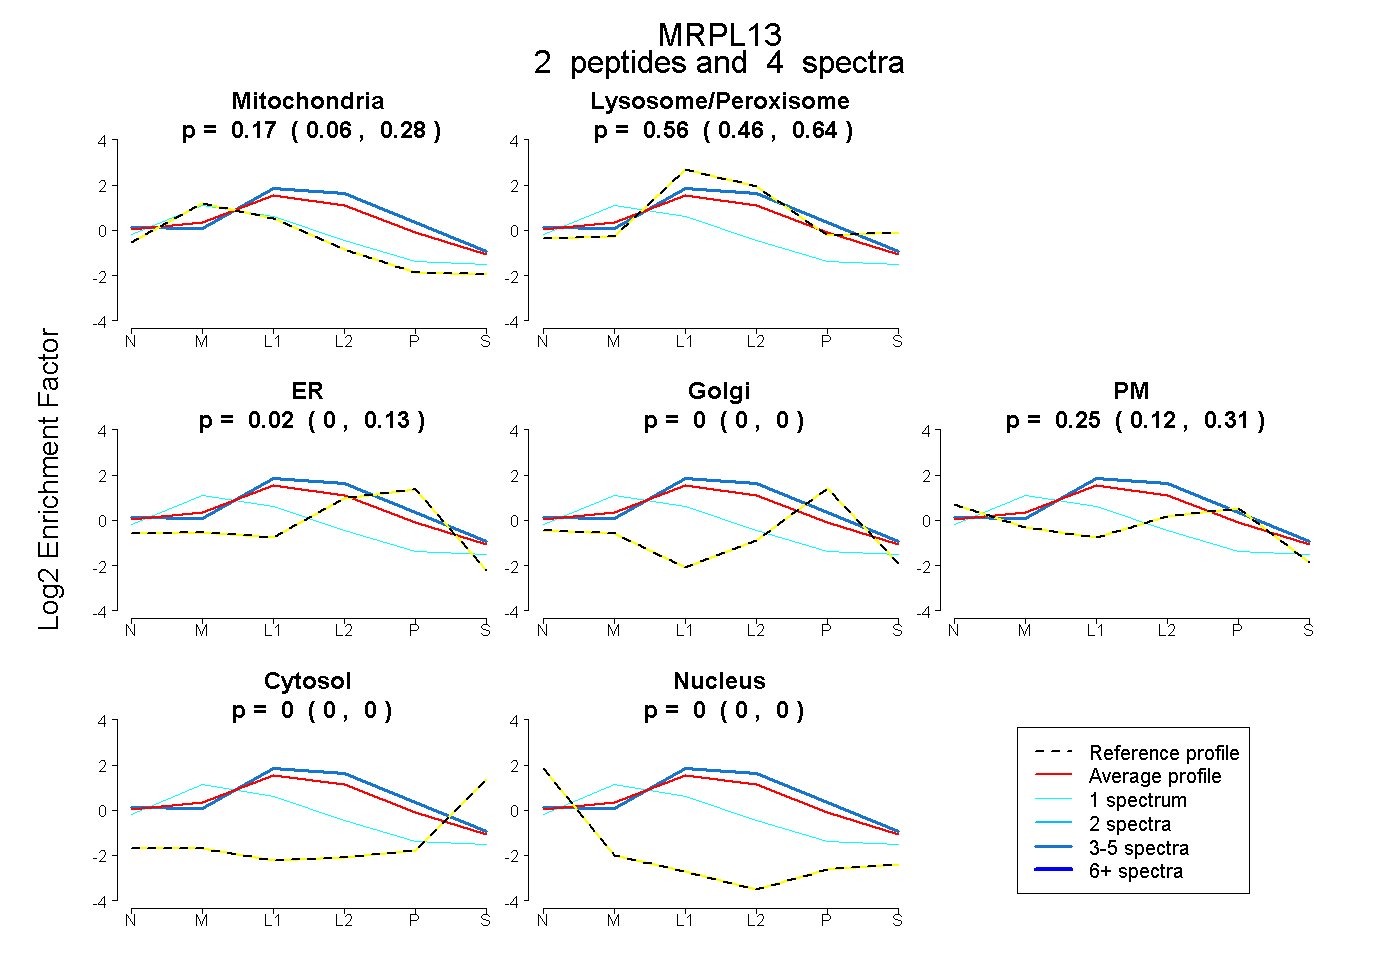
0.058 | 0.275
0.462 | 0.643
0.000 | 0.125
0.000 | 0.000
0.124 | 0.314
0.000 | 0.000
0.000 | 0.000
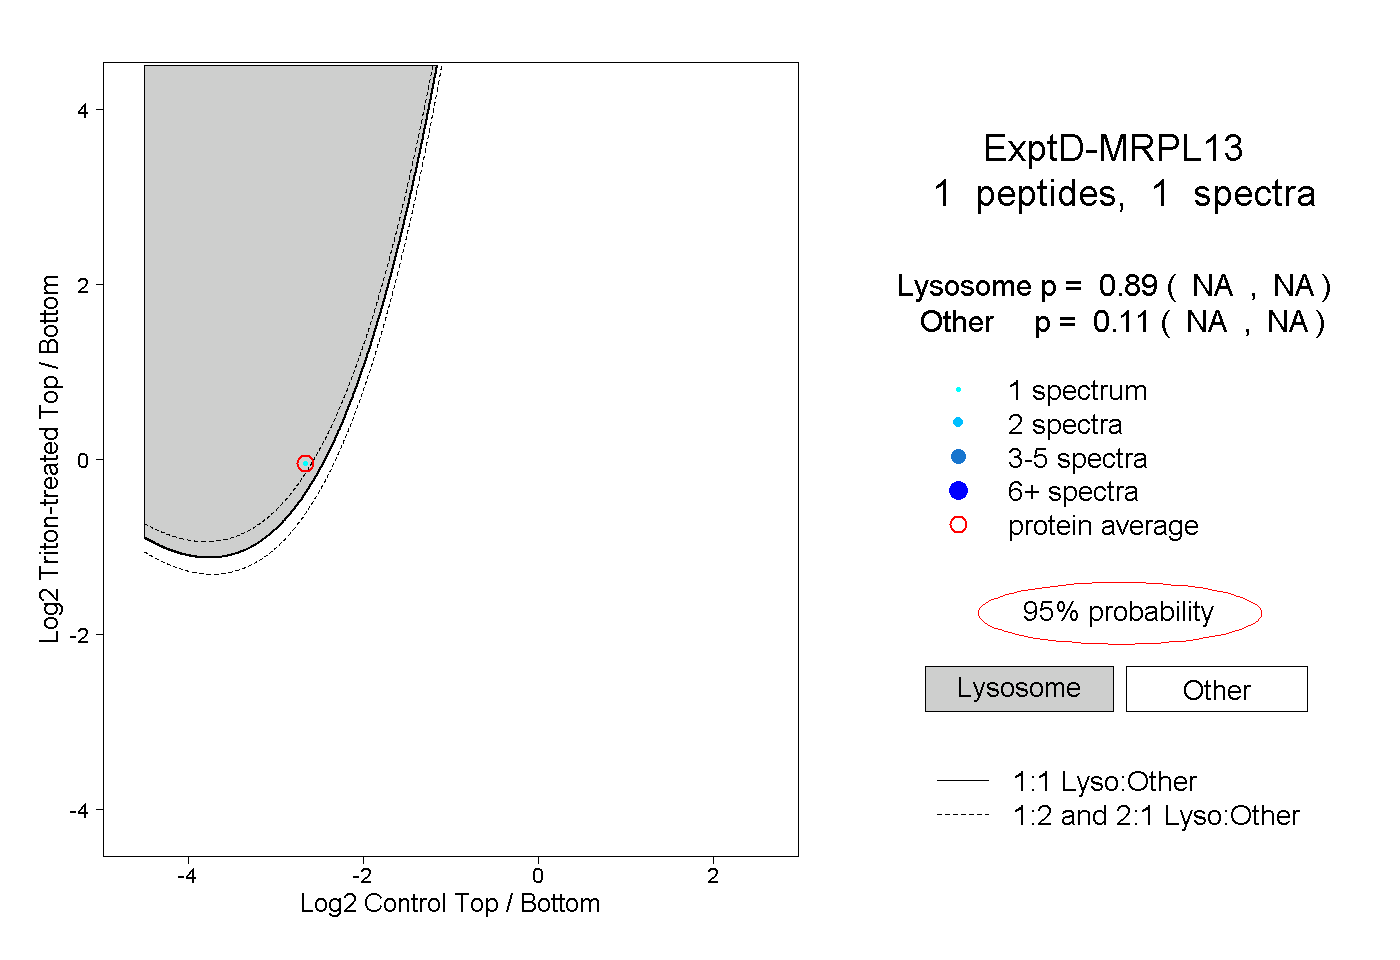
10peptides
spectra
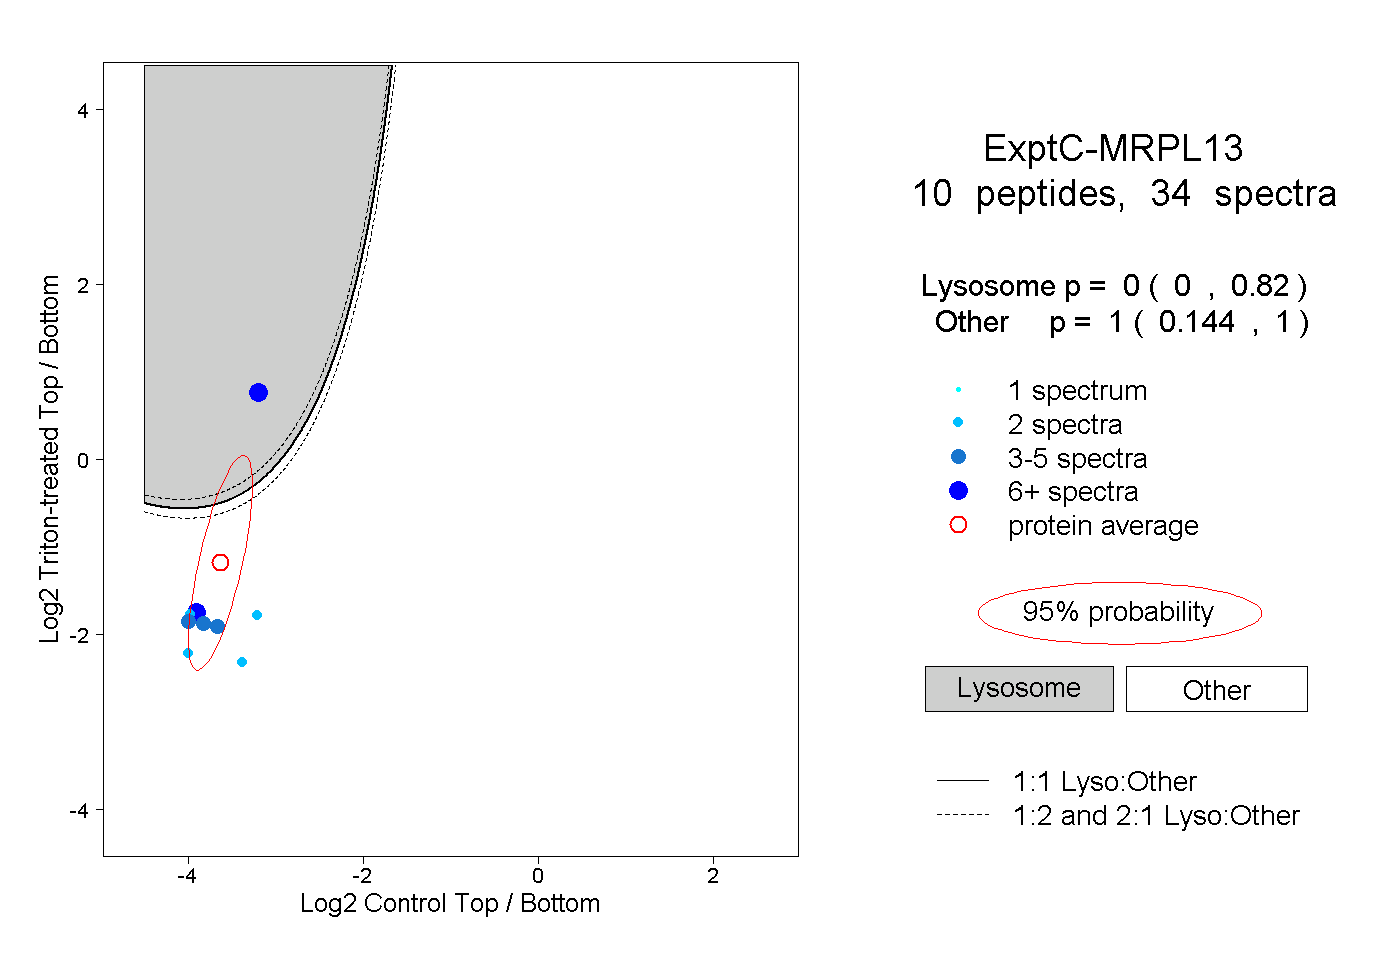
0.000 | 0.820
0.144 | 1.000