 2
2peptides
spectra
0.119 | 0.344
0.000 | 0.000
0.034 | 0.278
0.085 | 0.303
0.000 | 0.087
0.000 | 0.000
0.292 | 0.361
0.000 | 0.000
1peptide
spectrum
NA | NA
NA | NA
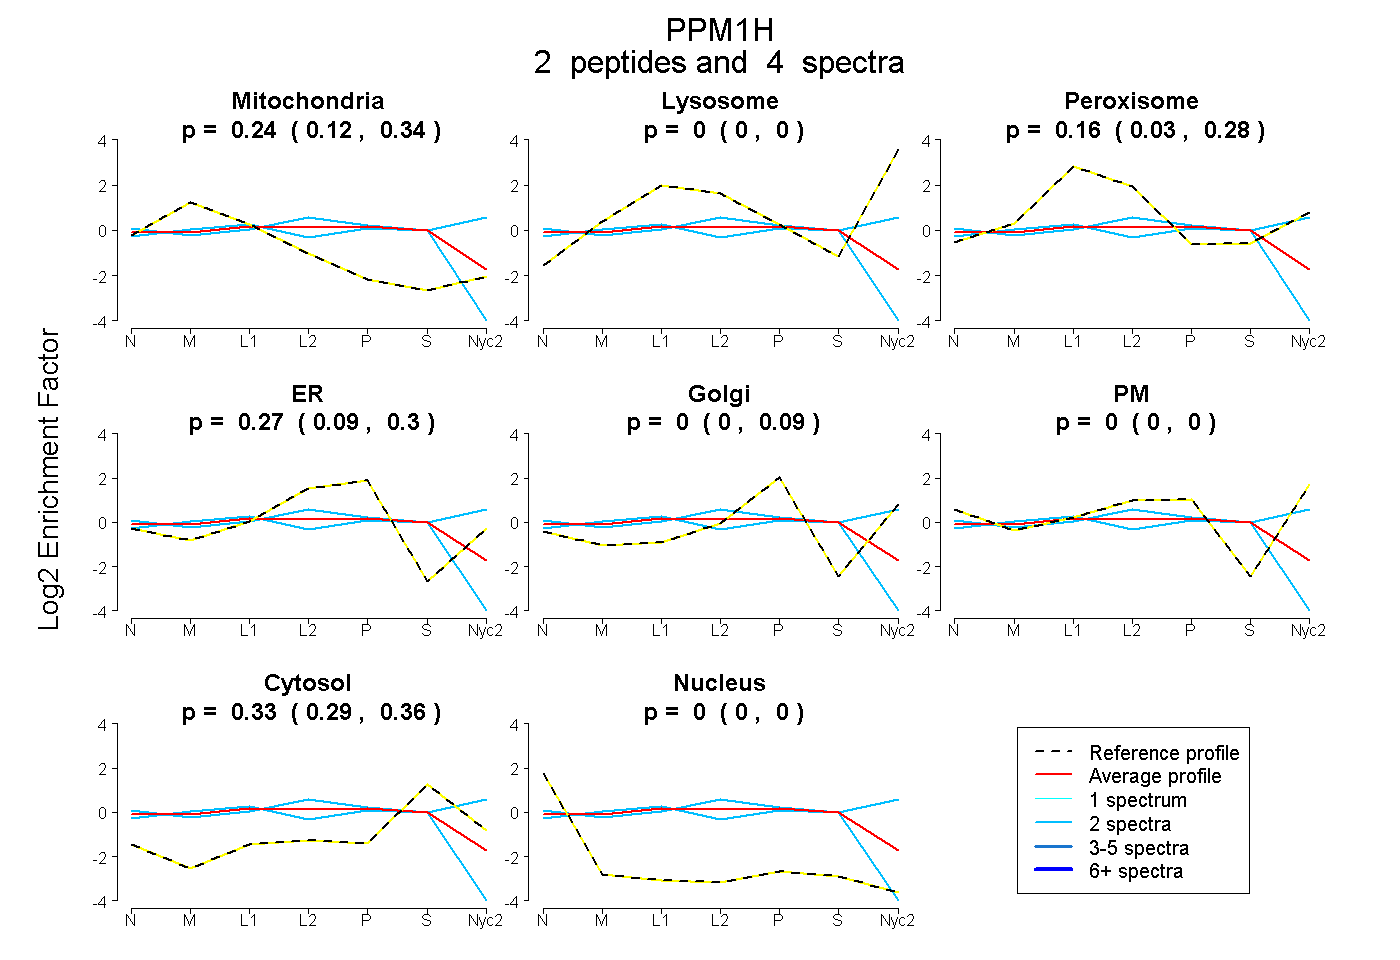
| Plot | Mito | Lyso | Perox | ER | Golgi | PM | Cytosol | Nucleus | |||||
| Expt A |
2 peptides |
4 spectra |
|
0.237 0.119 | 0.344 |
0.000 0.000 | 0.000 |
0.162 0.034 | 0.278 |
0.268 0.085 | 0.303 |
0.000 0.000 | 0.087 |
0.000 0.000 | 0.000 |
0.332 0.292 | 0.361 |
0.000 0.000 | 0.000 |
||
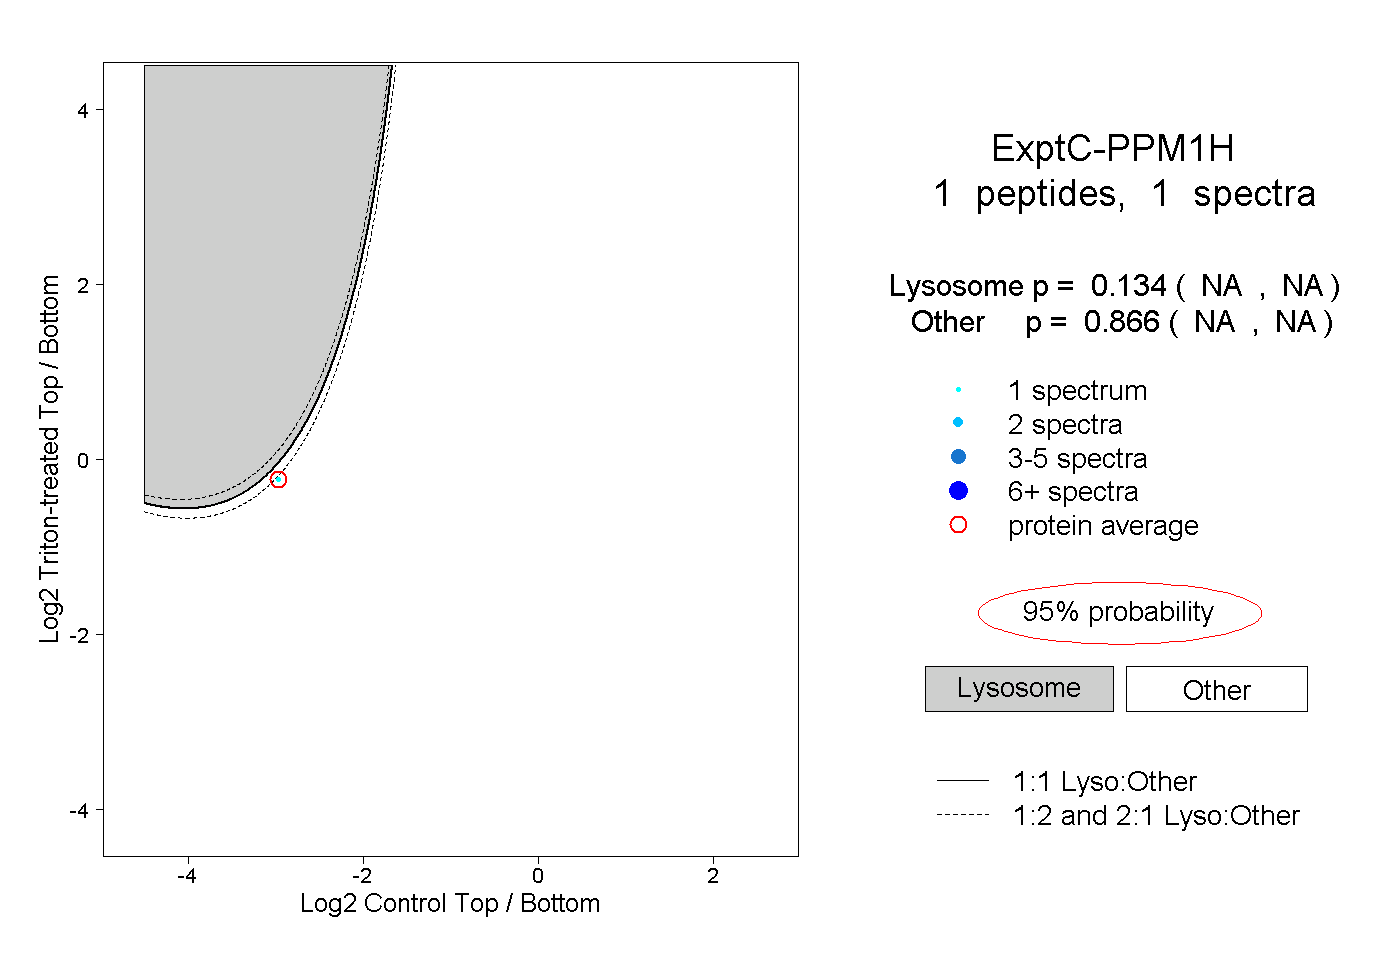
| Plot | Lyso | Other | |||||||||||
| Expt C |
1 peptide |
1 spectrum |
|
0.134 NA | NA |
0.866 NA | NA |