TIMP3
[ENSRNOP00000005746]
Main page
| | | Plot |
Mito |
Lyso |
|
Perox |
ER |
Golgi |
PM |
Cytosol |
Nucleus |
|
| Expt A |
 1
1
peptide |
1
spectrum |
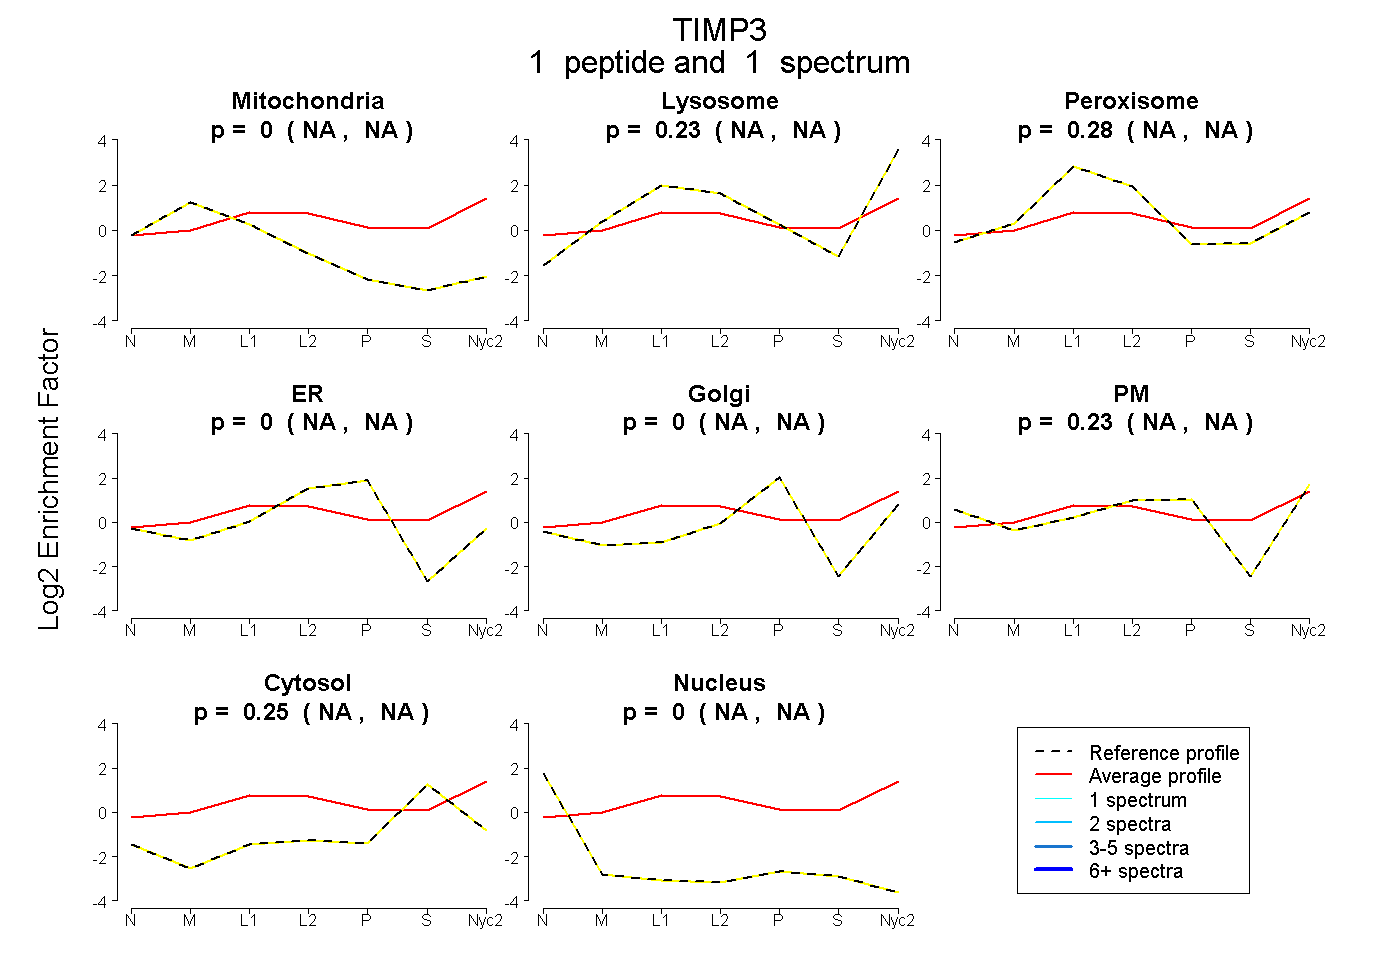 |
0.000
NA | NA |
0.233
NA | NA |
|
0.284
NA | NA |
0.000
NA | NA |
0.000
NA | NA |
0.231
NA | NA |
0.252
NA | NA |
0.000
NA | NA |
|
| | | Plot |
Mito |
|
Lyso or Perox |
|
ER |
Golgi |
PM |
Cytosol |
Nucleus |
|
| Expt B |
1
peptide |
1
spectrum |
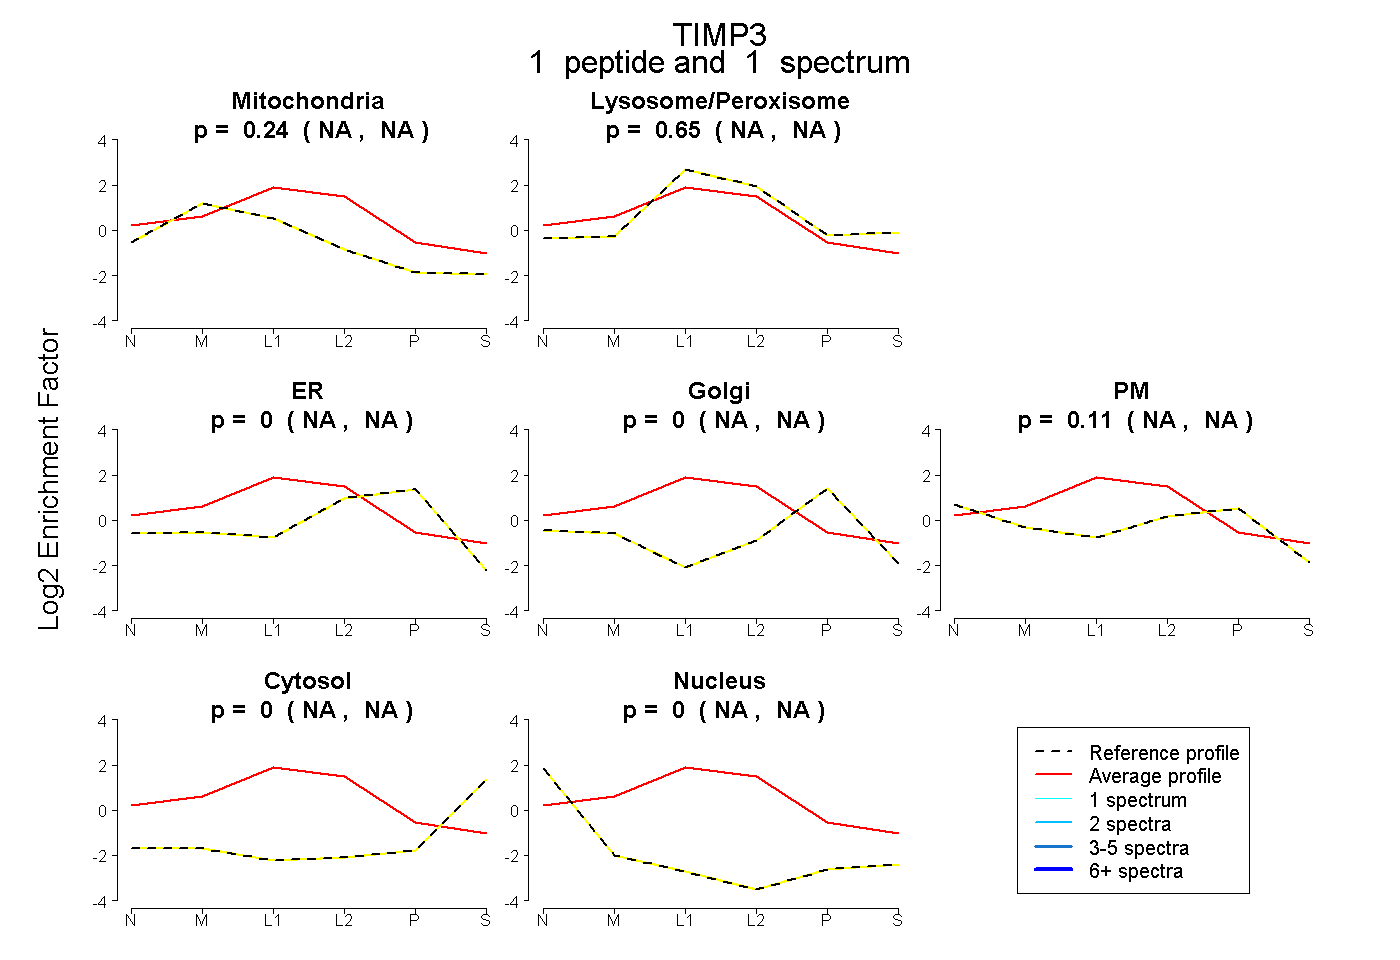 |
0.244
NA | NA |
|
0.650
NA | NA |
|
0.000
NA | NA |
0.000
NA | NA |
0.105
NA | NA |
0.000
NA | NA |
0.000
NA | NA |
|
| | | Plot |
|
Lyso |
|
|
|
|
|
|
|
Other |
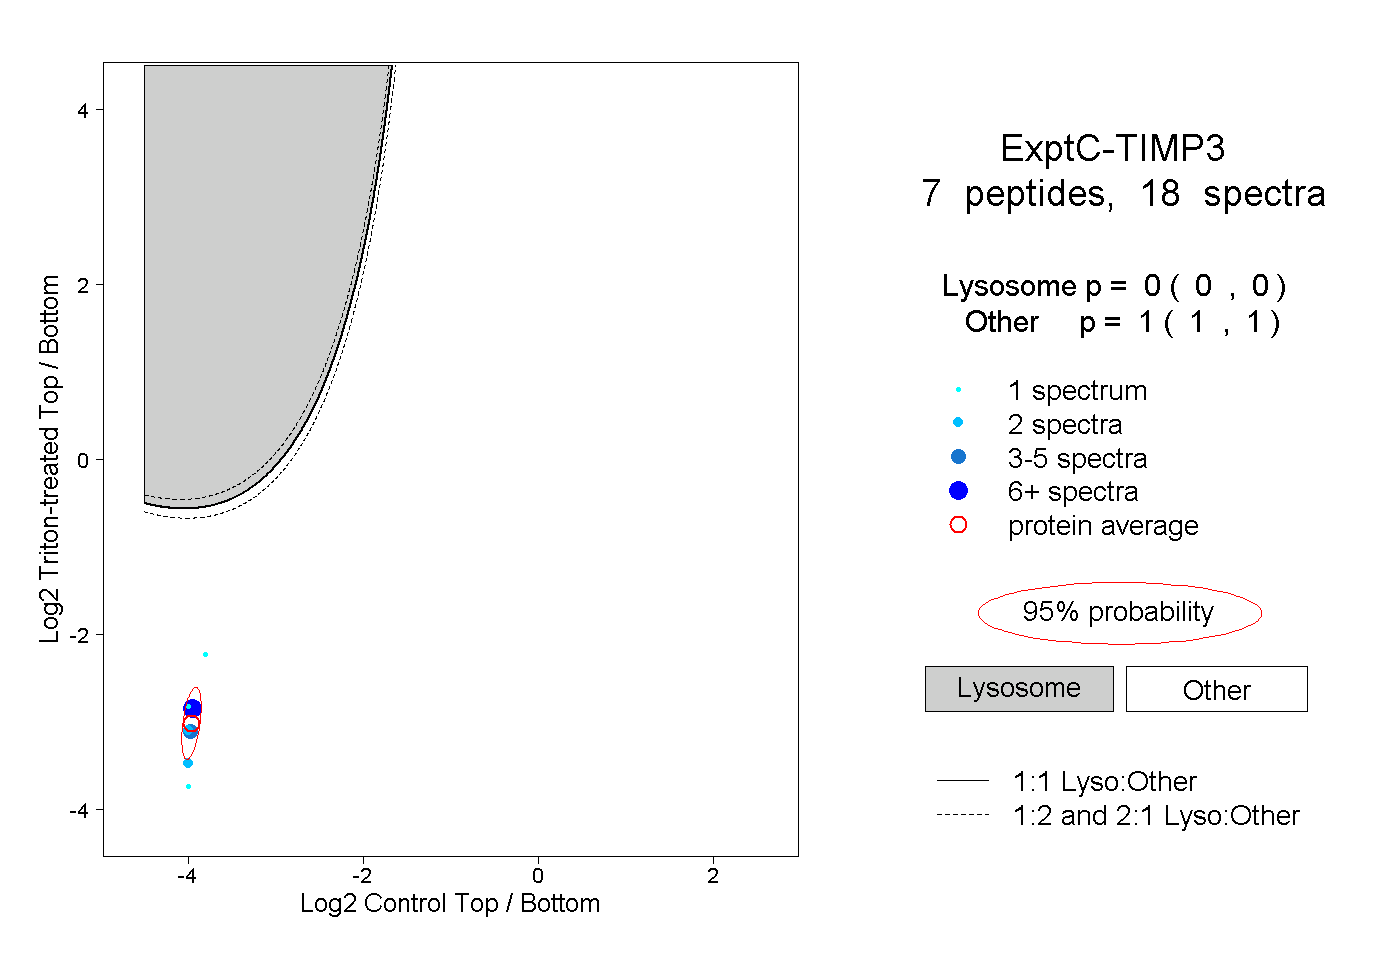
| Expt C |
7
peptides |
18
spectra |
 |
|
0.000
0.000 | 0.000 |
|
|
|
|
|
|
|
1.000
1.000 | 1.000 |
| 2 spectra, GWAPPDK |
|
0.000 |
|
|
|
|
|
|
|
1.000 |
| 1 spectrum, YHLGCNCK |
|
0.000 |
|
|
|
|
|
|
|
1.000 |
| 2 spectra, YQYLLTGR |
|
0.000 |
|
|
|
|
|
|
|
1.000 |
| 1 spectrum, MYTGLCNFVER |
|
0.000 |
|
|
|
|
|
|
|
1.000 |
| 1 spectrum, SCYYLPCFVTSK |
|
0.000 |
|
|
|
|
|
|
|
1.000 |
| 7 spectra, HYACIR |
|
0.000 |
|
|
|
|
|
|
|
1.000 |
| 4 spectra, EGPFGTLVYTIK |
|
0.000 |
|
|
|
|
|
|
|
1.000 |