 5
5peptides
spectra
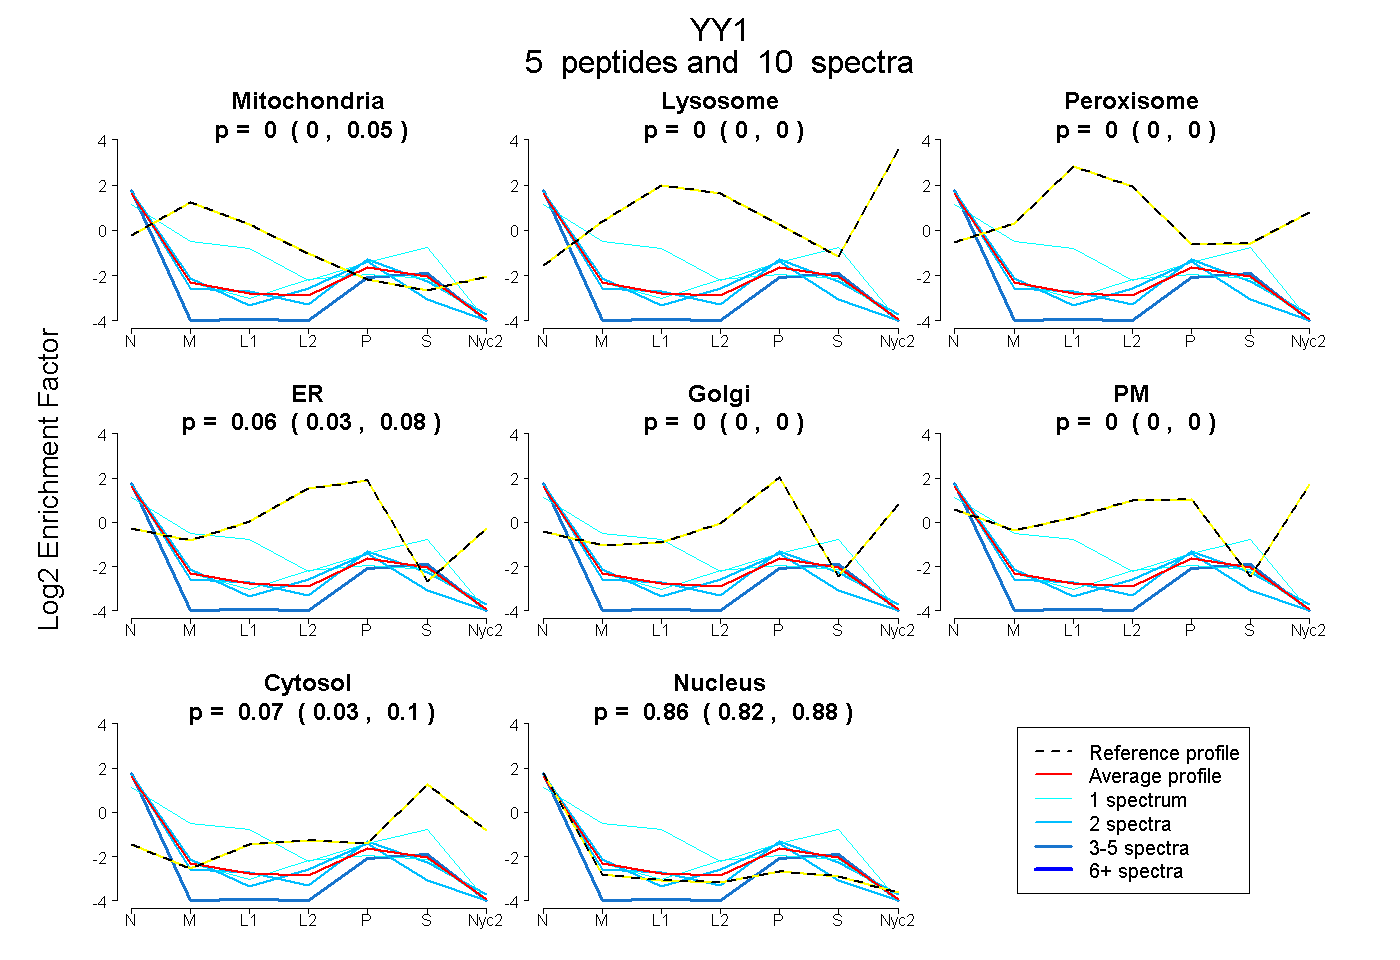
0.000 | 0.051
0.000 | 0.000
0.000 | 0.000
0.026 | 0.084
0.000 | 0.000
0.000 | 0.000
0.032 | 0.105
0.822 | 0.884
1peptide
spectra
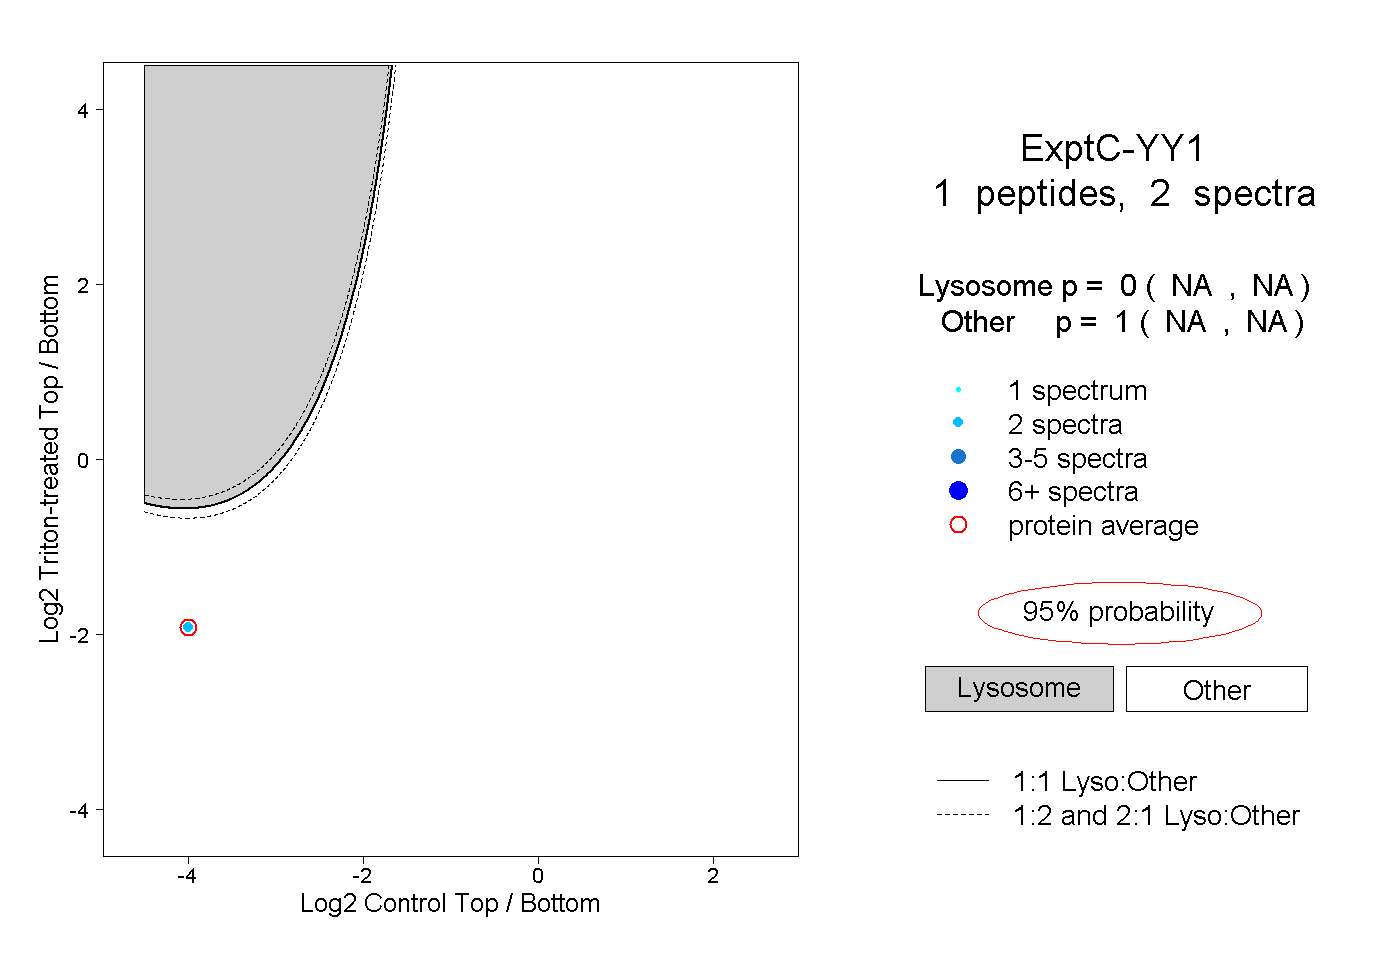
NA | NA
NA | NA
| Plot | Mito | Lyso | Perox | ER | Golgi | PM | Cytosol | Nucleus | |||||
| Expt A |
5 peptides |
10 spectra |
|
0.000 0.000 | 0.051 |
0.000 0.000 | 0.000 |
0.000 0.000 | 0.000 |
0.064 0.026 | 0.084 |
0.000 0.000 | 0.000 |
0.000 0.000 | 0.000 |
0.073 0.032 | 0.105 |
0.862 0.822 | 0.884 |
||
| Plot | Lyso | Other | |||||||||||
| Expt C |
1 peptide |
2 spectra |
|
0.000 NA | NA |
1.000 NA | NA |