 2
2peptides
spectra
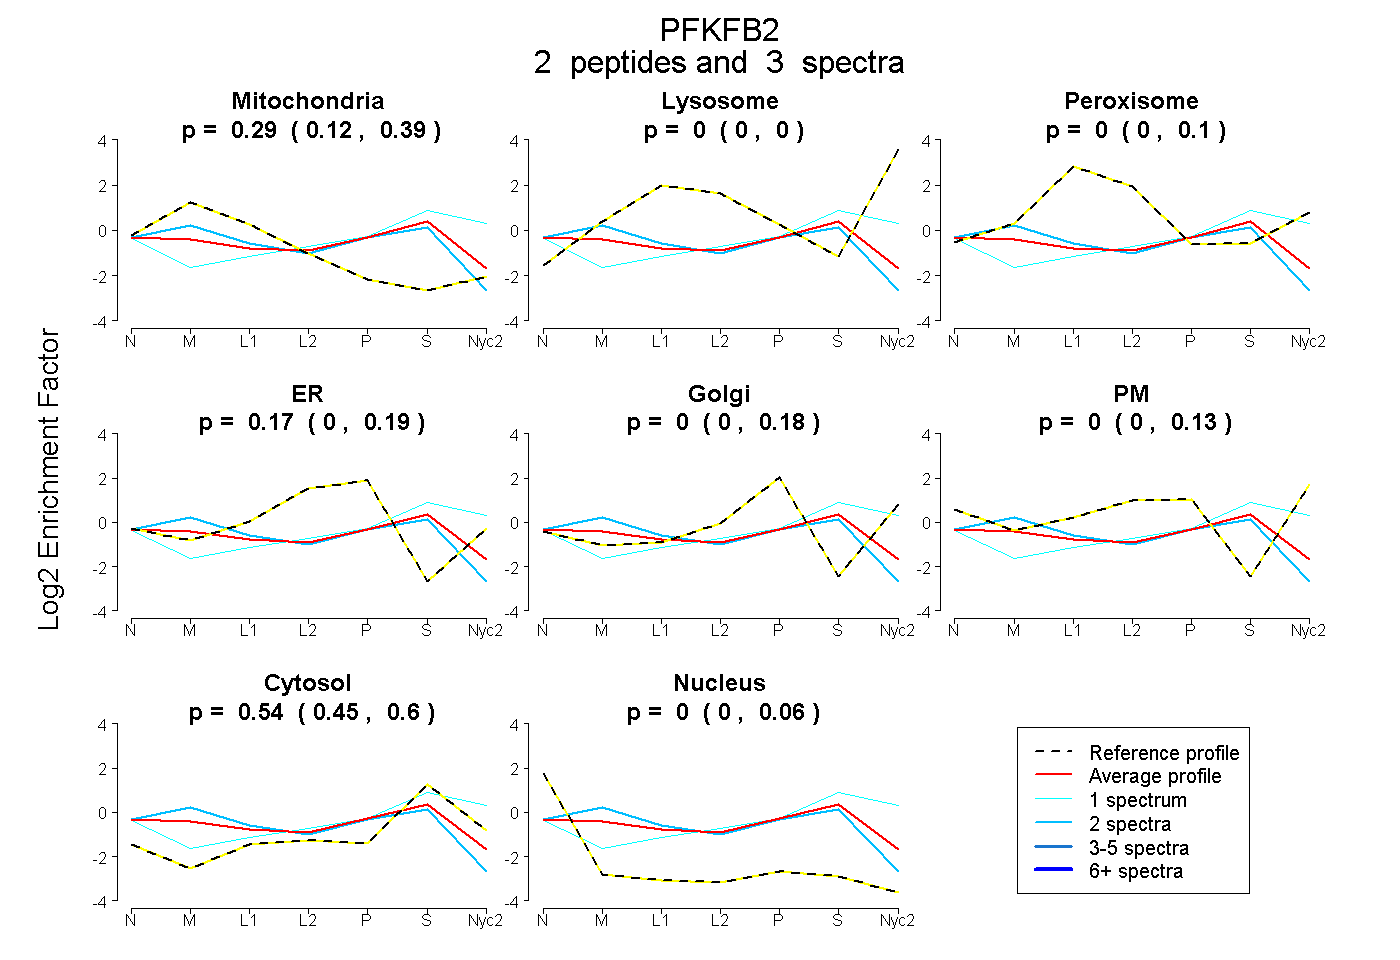
0.122 | 0.391
0.000 | 0.000
0.000 | 0.102
0.000 | 0.187
0.000 | 0.177
0.000 | 0.132
0.445 | 0.599
0.000 | 0.064
1peptide
spectrum
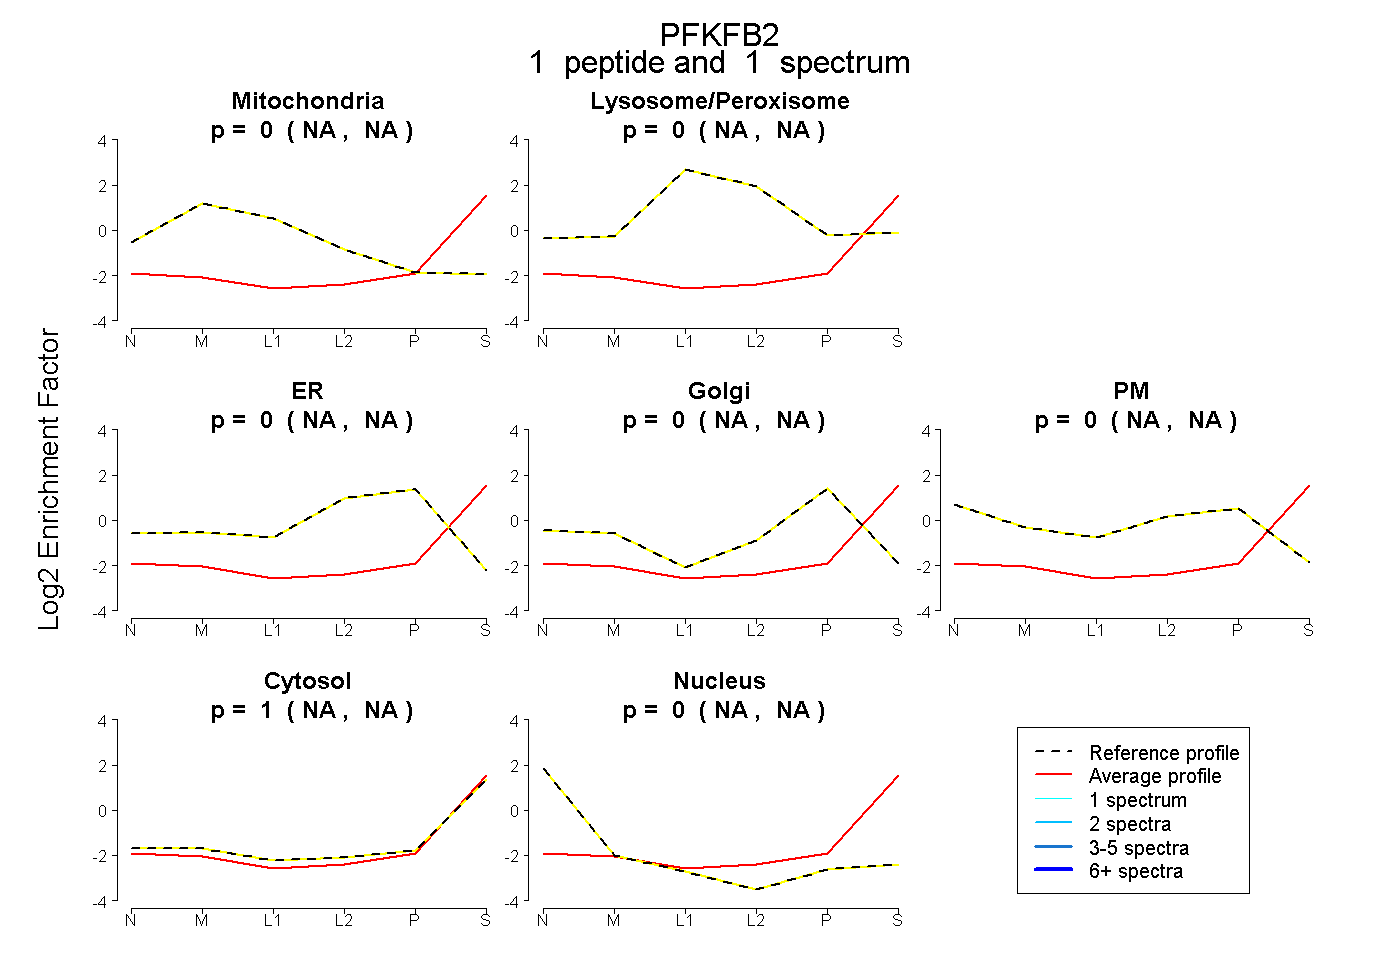
NA | NA
NA | NA
NA | NA
NA | NA
NA | NA
NA | NA
NA | NA
1peptide
spectra
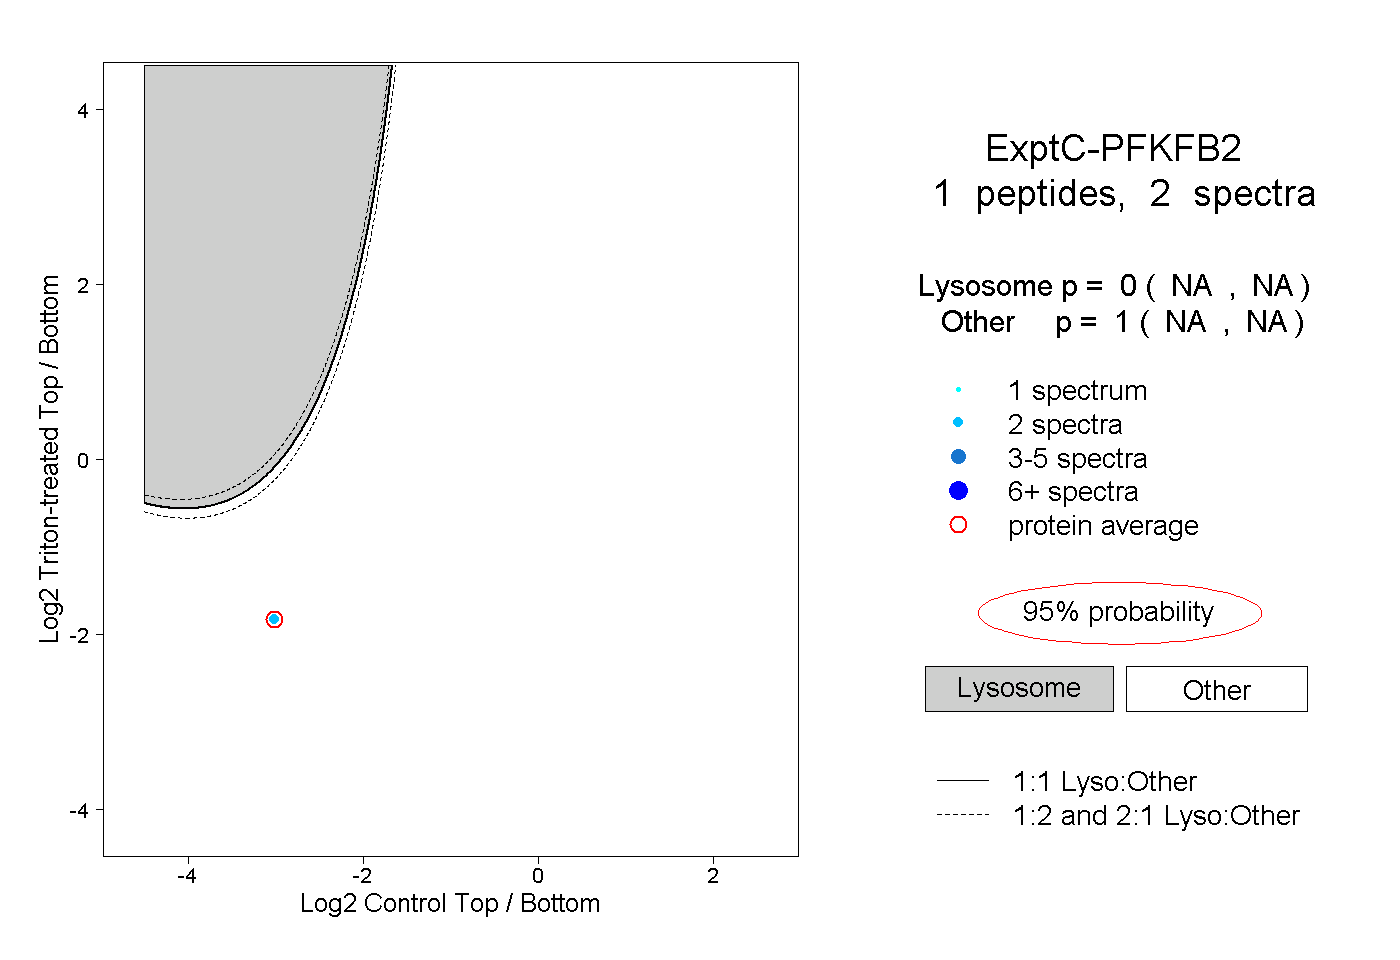
NA | NA
NA | NA