 4
4peptides
spectra
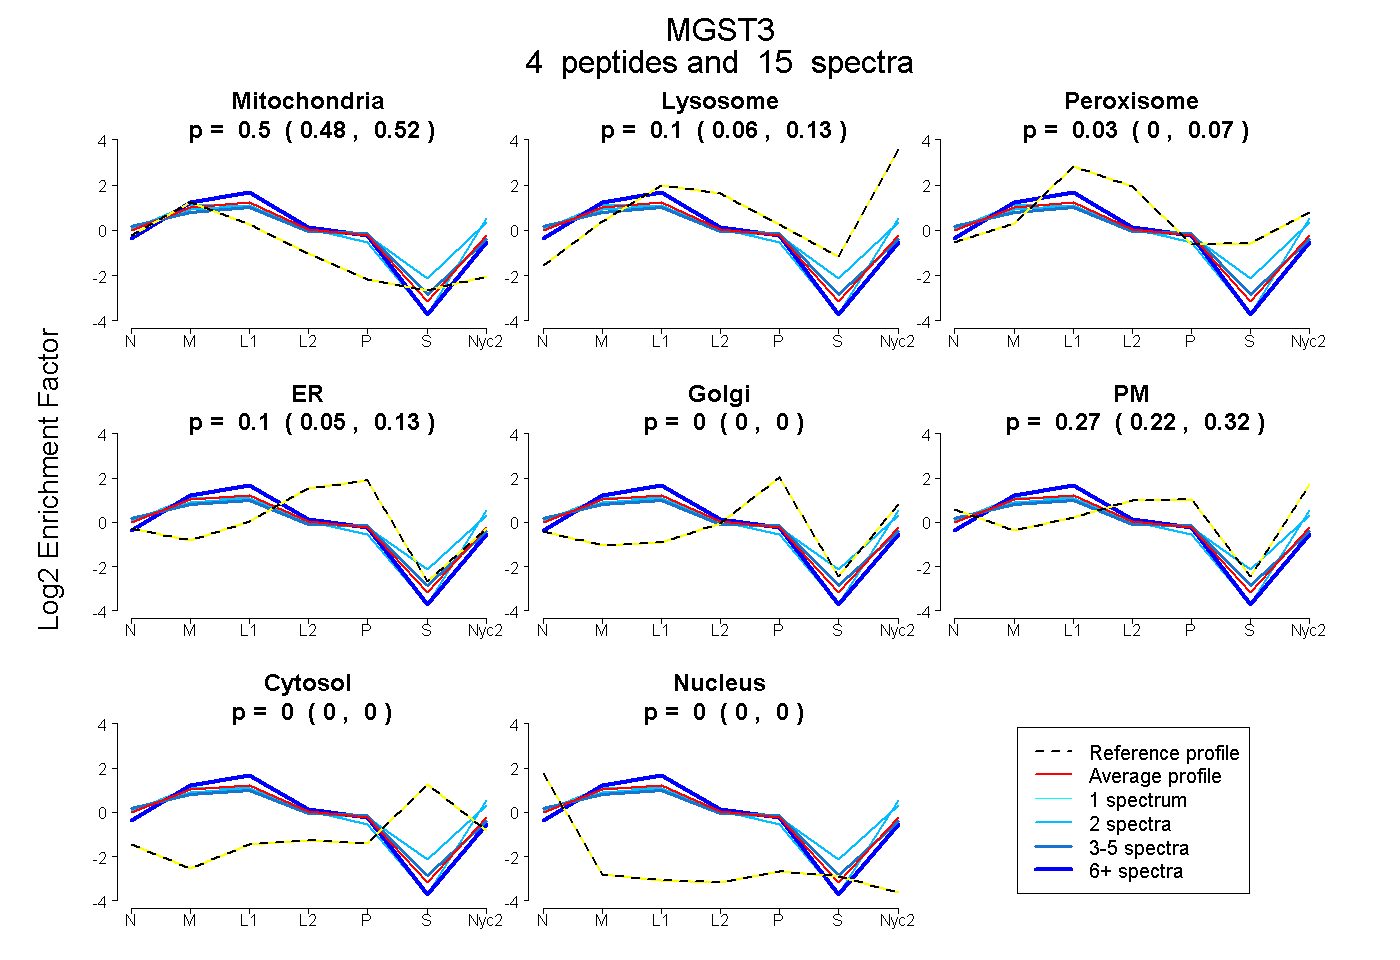
0.483 | 0.515
0.057 | 0.127
0.000 | 0.073
0.049 | 0.132
0.000 | 0.000
0.219 | 0.318
0.000 | 0.000
0.000 | 0.000
2peptides
spectra
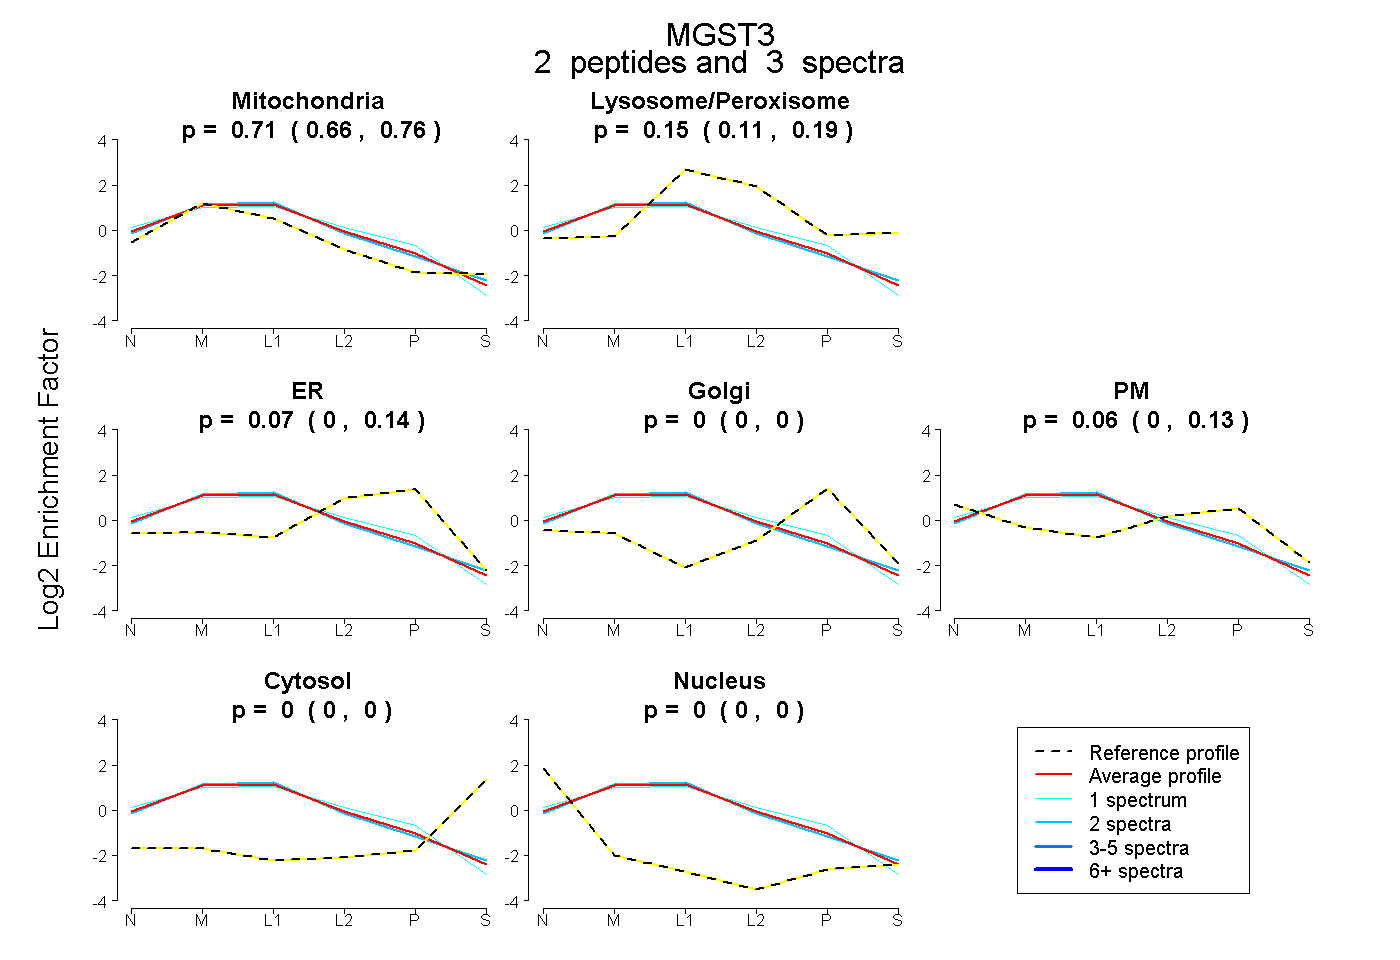
0.661 | 0.755
0.109 | 0.191
0.000 | 0.141
0.000 | 0.000
0.000 | 0.126
0.000 | 0.000
0.000 | 0.000
3peptides
spectra
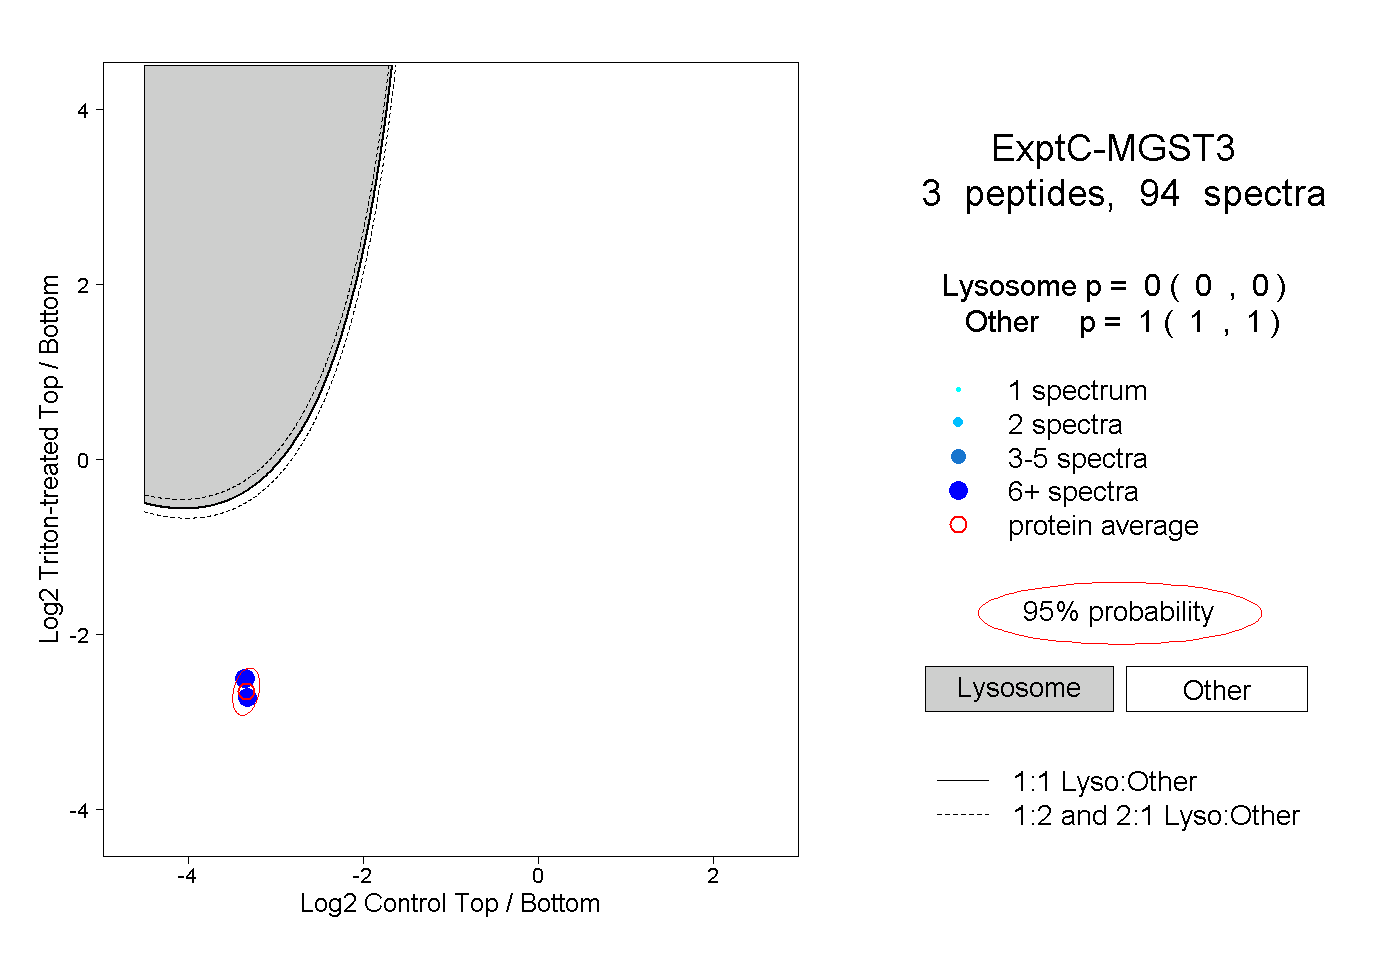
0.000 | 0.000
1.000 | 1.000
1peptide
spectra
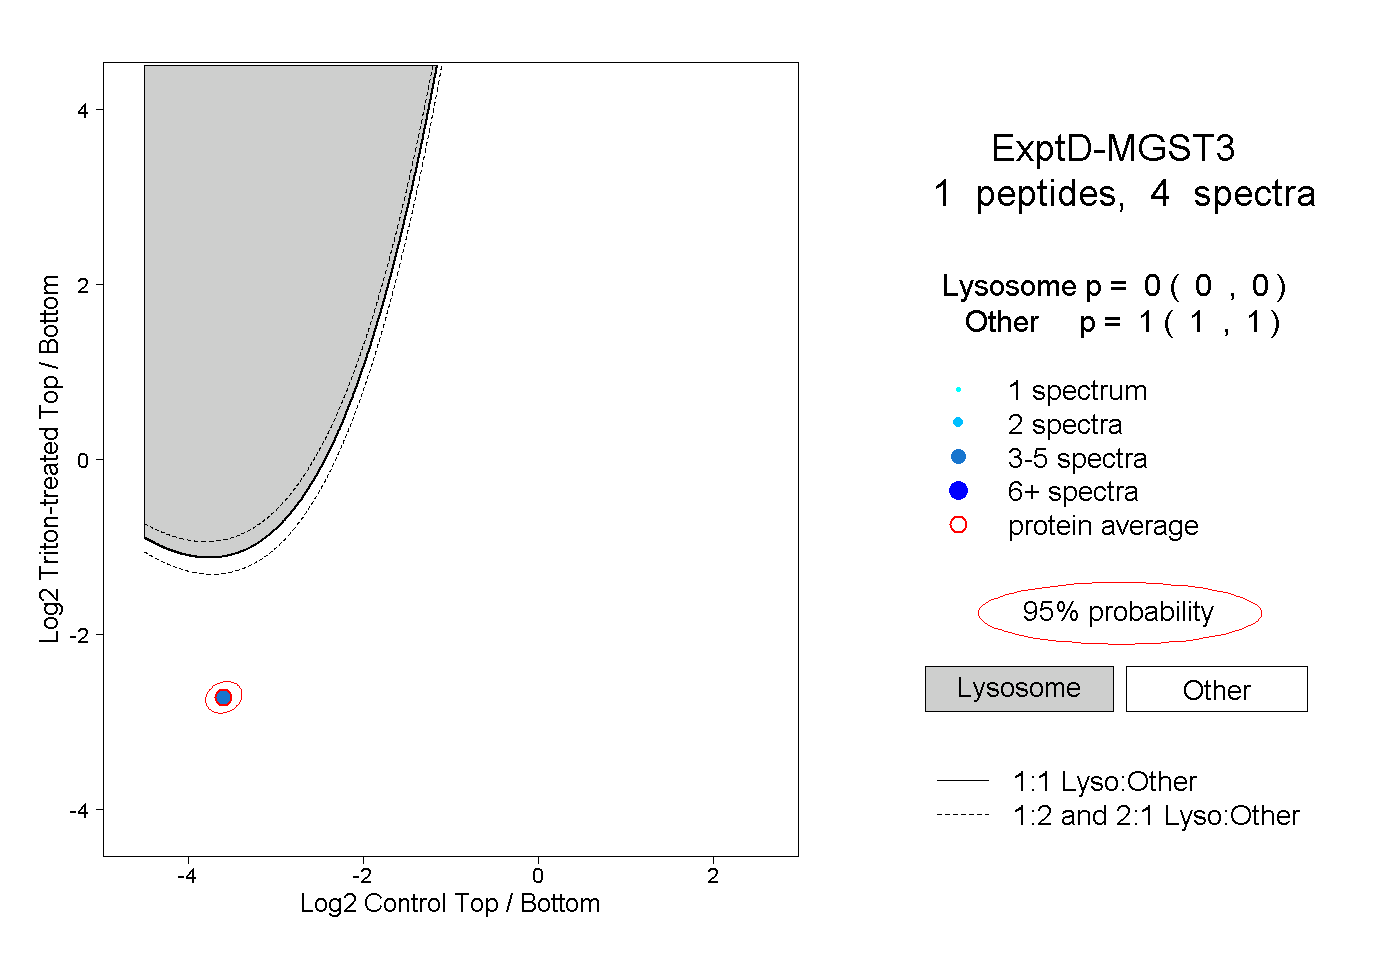
0.000 | 0.000
1.000 | 1.000