 4
4peptides
spectra
0.483 | 0.515
0.057 | 0.127
0.000 | 0.073
0.049 | 0.132
0.000 | 0.000
0.219 | 0.318
0.000 | 0.000
0.000 | 0.000
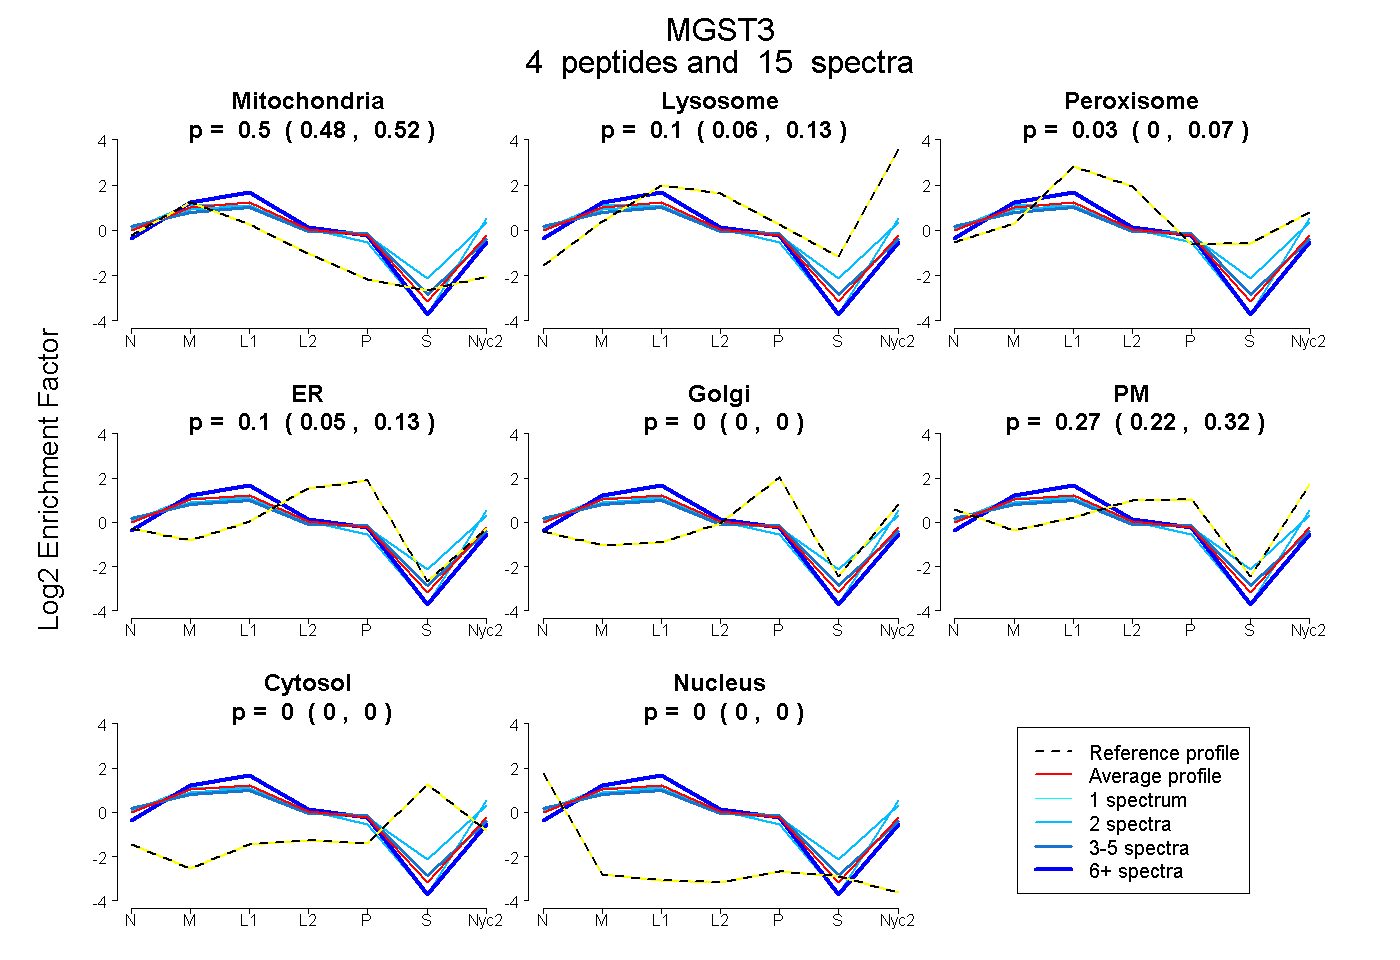
| Plot | Mito | Lyso | Perox | ER | Golgi | PM | Cytosol | Nucleus | |||||
| Expt A |
4 peptides |
15 spectra |
|
0.502 0.483 | 0.515 |
0.098 0.057 | 0.127 |
0.032 0.000 | 0.073 |
0.096 0.049 | 0.132 |
0.000 0.000 | 0.000 |
0.272 0.219 | 0.318 |
0.000 0.000 | 0.000 |
0.000 0.000 | 0.000 |
| 2 spectra, AVLSK | 0.418 | 0.128 | 0.110 | 0.000 | 0.000 | 0.344 | 0.000 | 0.000 | ||
| 6 spectra, VEYPVMYSTDPENGHMFNCIQR | 0.550 | 0.190 | 0.000 | 0.260 | 0.000 | 0.000 | 0.000 | 0.000 | ||
| 5 spectra, VLYAYGYYTGDPSK | 0.476 | 0.000 | 0.075 | 0.102 | 0.000 | 0.346 | 0.000 | 0.000 | ||
| 2 spectra, IASGLGVAWIIGR | 0.472 | 0.141 | 0.000 | 0.000 | 0.000 | 0.387 | 0.000 | 0.000 |
| Plot | Mito | Lyso or Perox | ER | Golgi | PM | Cytosol | Nucleus | ||||||
| Expt B |
2 peptides |
3 spectra |
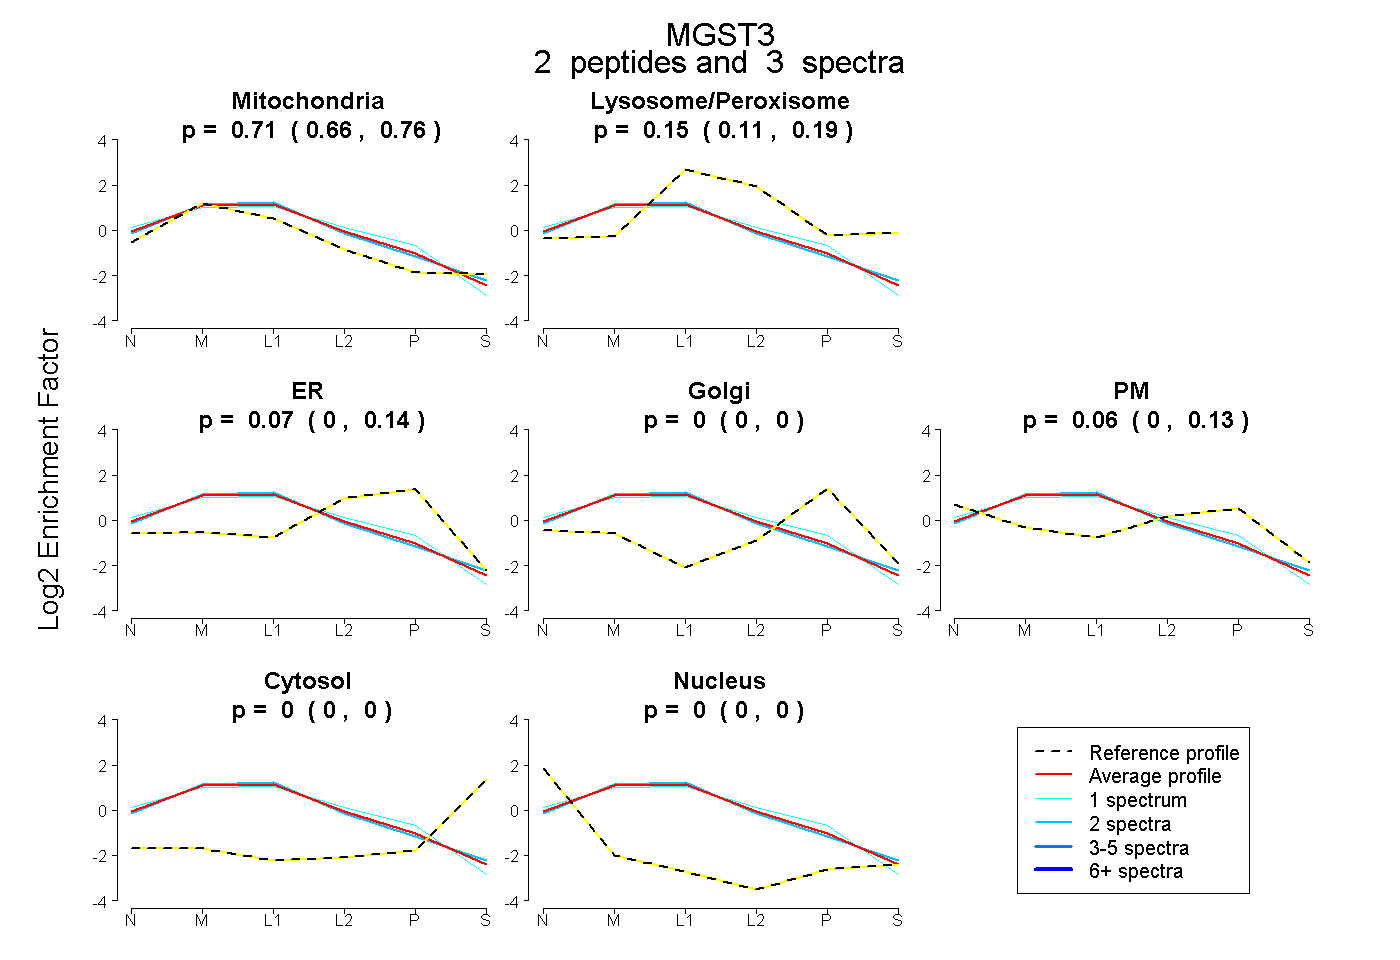 |
0.714 0.661 | 0.755 |
0.155 0.109 | 0.191 |
0.074 0.000 | 0.141 |
0.000 0.000 | 0.000 |
0.058 0.000 | 0.126 |
0.000 0.000 | 0.000 |
0.000 0.000 | 0.000 |
|||
| Plot | Lyso | Other | |||||||||||
| Expt C |
3 peptides |
94 spectra |
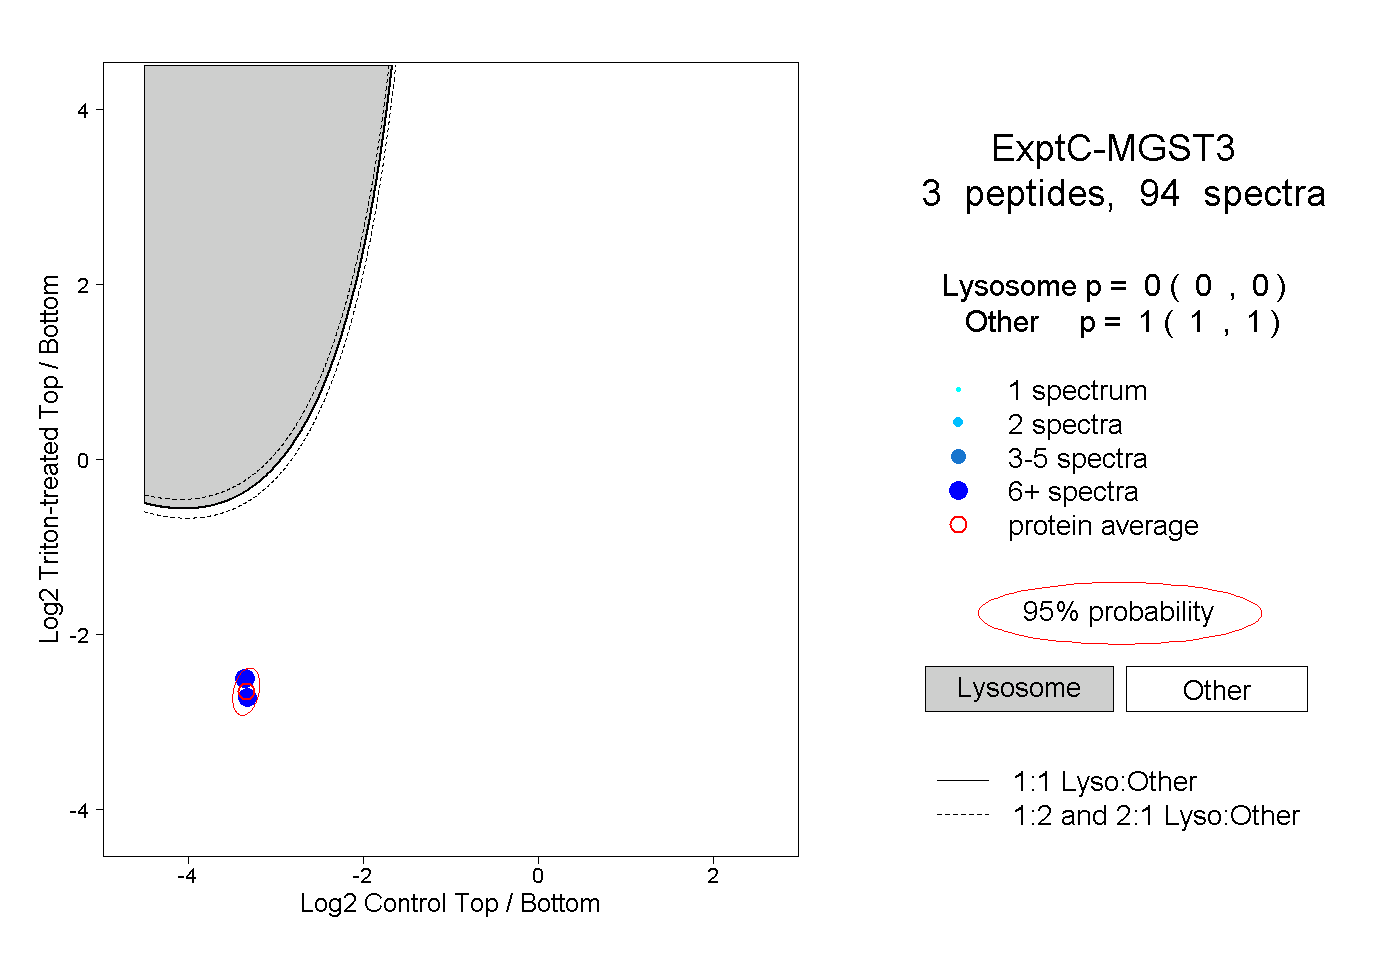 |
0.000 0.000 | 0.000 |
1.000 1.000 | 1.000 |
||||||||
| Plot | Lyso | Other | |||||||||||
| Expt D |
1 peptide |
4 spectra |
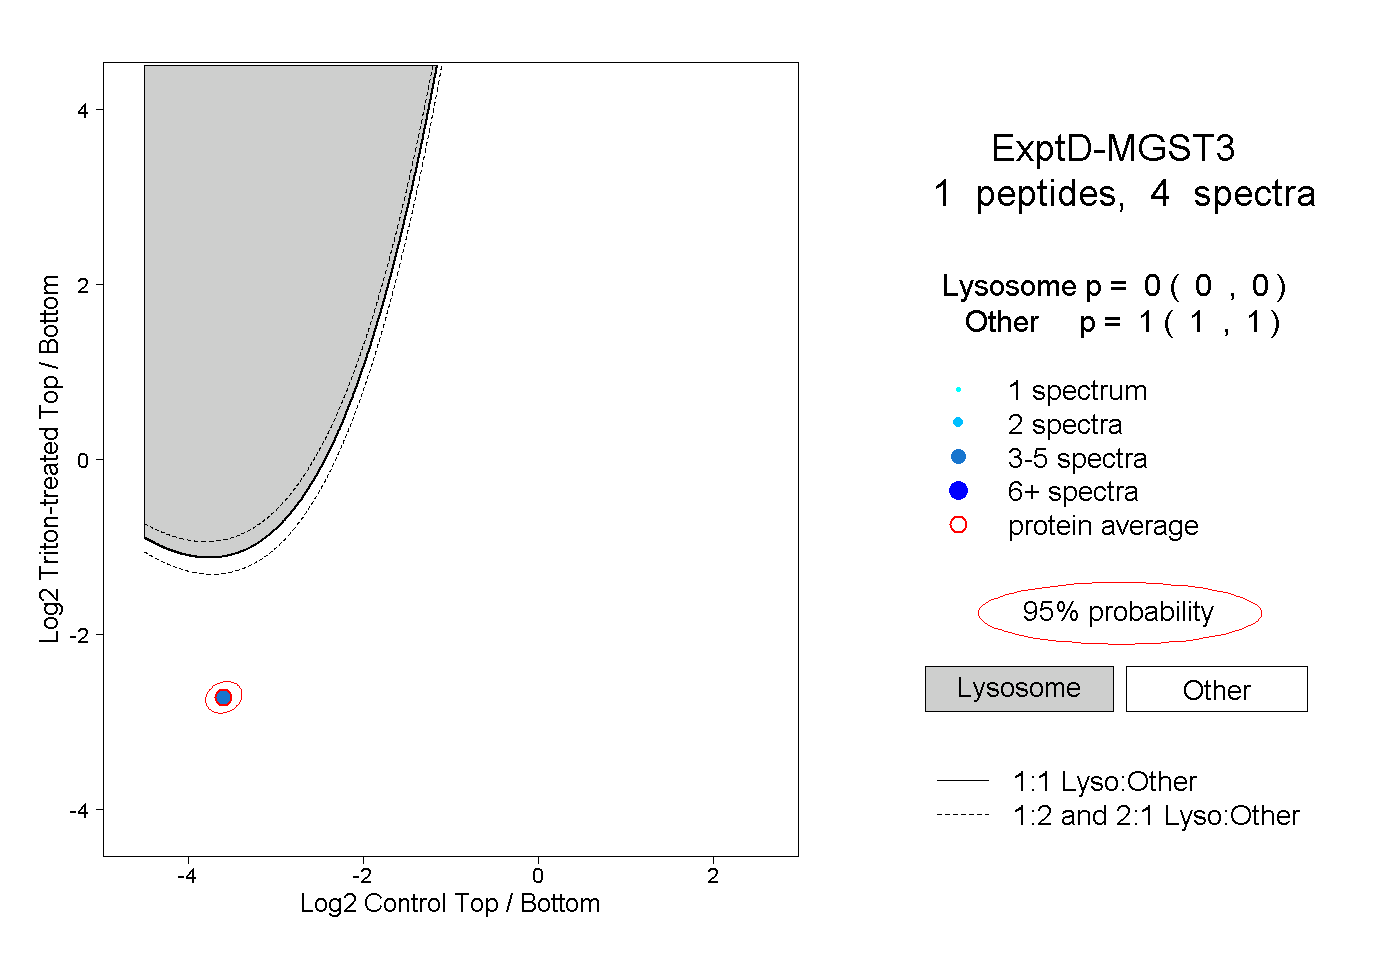 |
0.000 0.000 | 0.000 |
1.000 1.000 | 1.000 |