 3
3peptides
spectra
0.000 | 0.000
0.000 | 0.000
0.000 | 0.000
0.000 | 0.010
0.000 | 0.036
0.000 | 0.000
0.193 | 0.283
0.694 | 0.799
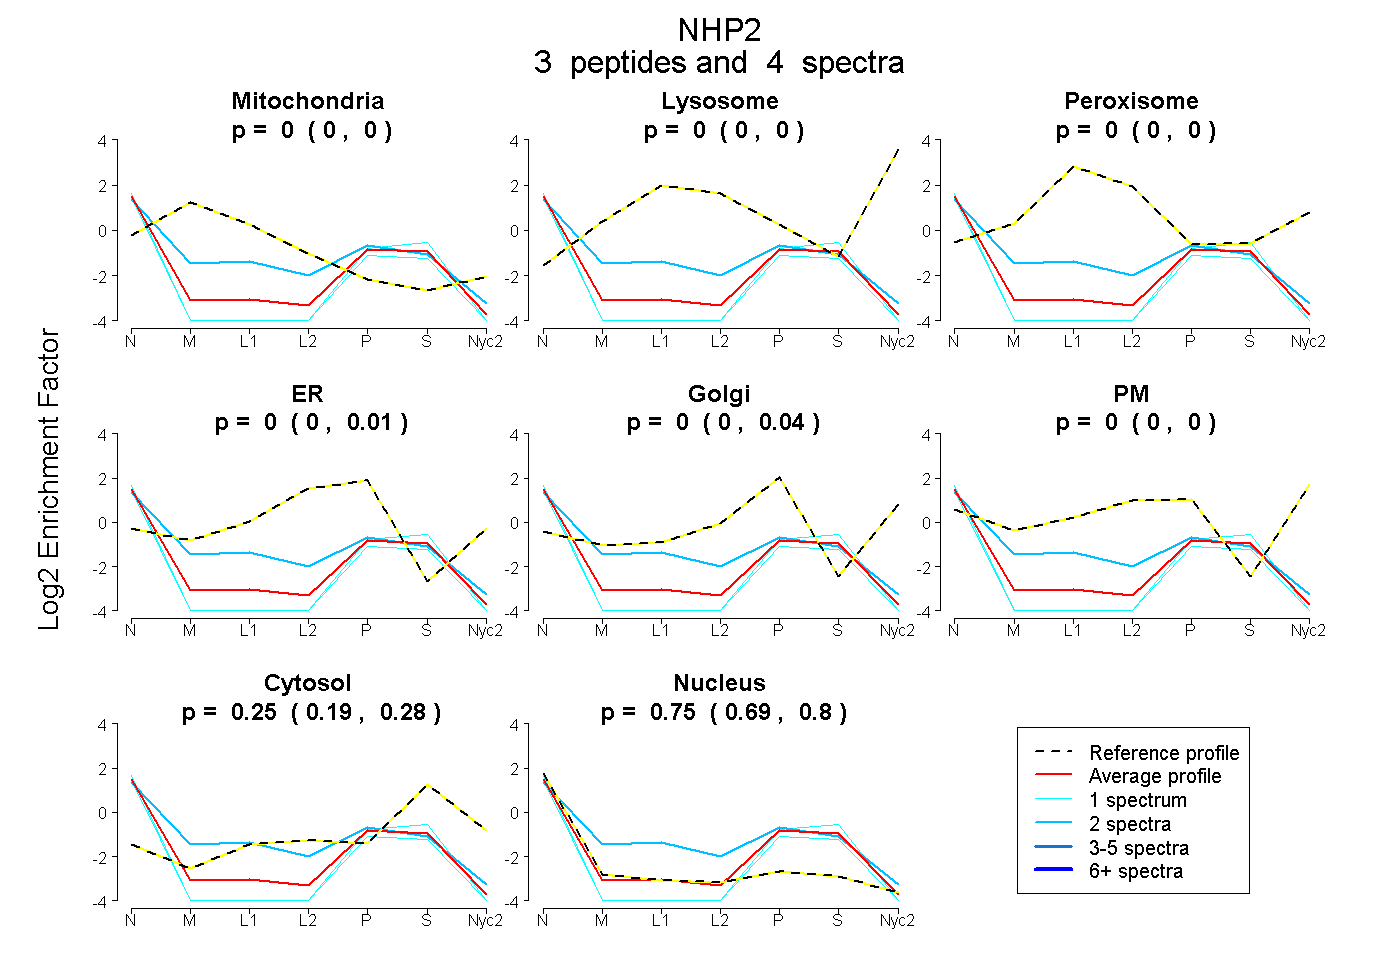
| Plot | Mito | Lyso | Perox | ER | Golgi | PM | Cytosol | Nucleus | |||||
| Expt A |
3 peptides |
4 spectra |
|
0.000 0.000 | 0.000 |
0.000 0.000 | 0.000 |
0.000 0.000 | 0.000 |
0.000 0.000 | 0.010 |
0.000 0.000 | 0.036 |
0.000 0.000 | 0.000 |
0.249 0.193 | 0.283 |
0.751 0.694 | 0.799 |
| 2 spectra, TDLGAATGSK | 0.107 | 0.000 | 0.023 | 0.171 | 0.000 | 0.000 | 0.179 | 0.520 | ||
| 1 spectrum, RPTCVIMVKPHEDYQEAYDK | 0.000 | 0.000 | 0.000 | 0.000 | 0.000 | 0.000 | 0.202 | 0.798 | ||
| 1 spectrum, TYEELLVNLNPIAQPLASR | 0.000 | 0.000 | 0.000 | 0.000 | 0.000 | 0.000 | 0.110 | 0.890 |