 2
2peptides
spectra
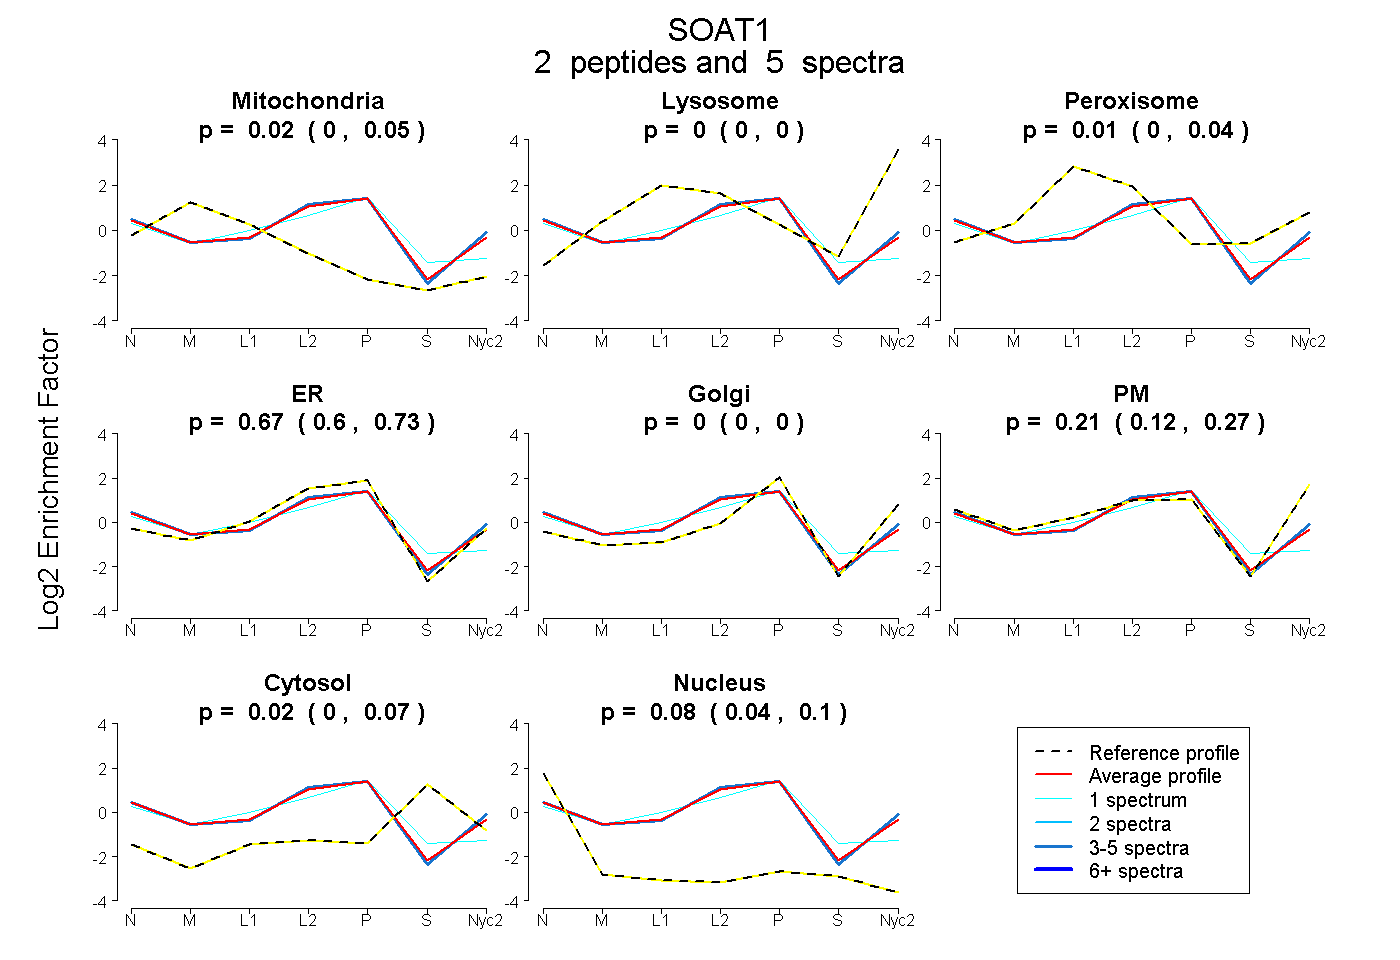
0.000 | 0.049
0.000 | 0.000
0.000 | 0.043
0.598 | 0.727
0.000 | 0.000
0.121 | 0.275
0.000 | 0.072
0.042 | 0.096
2peptides
spectra
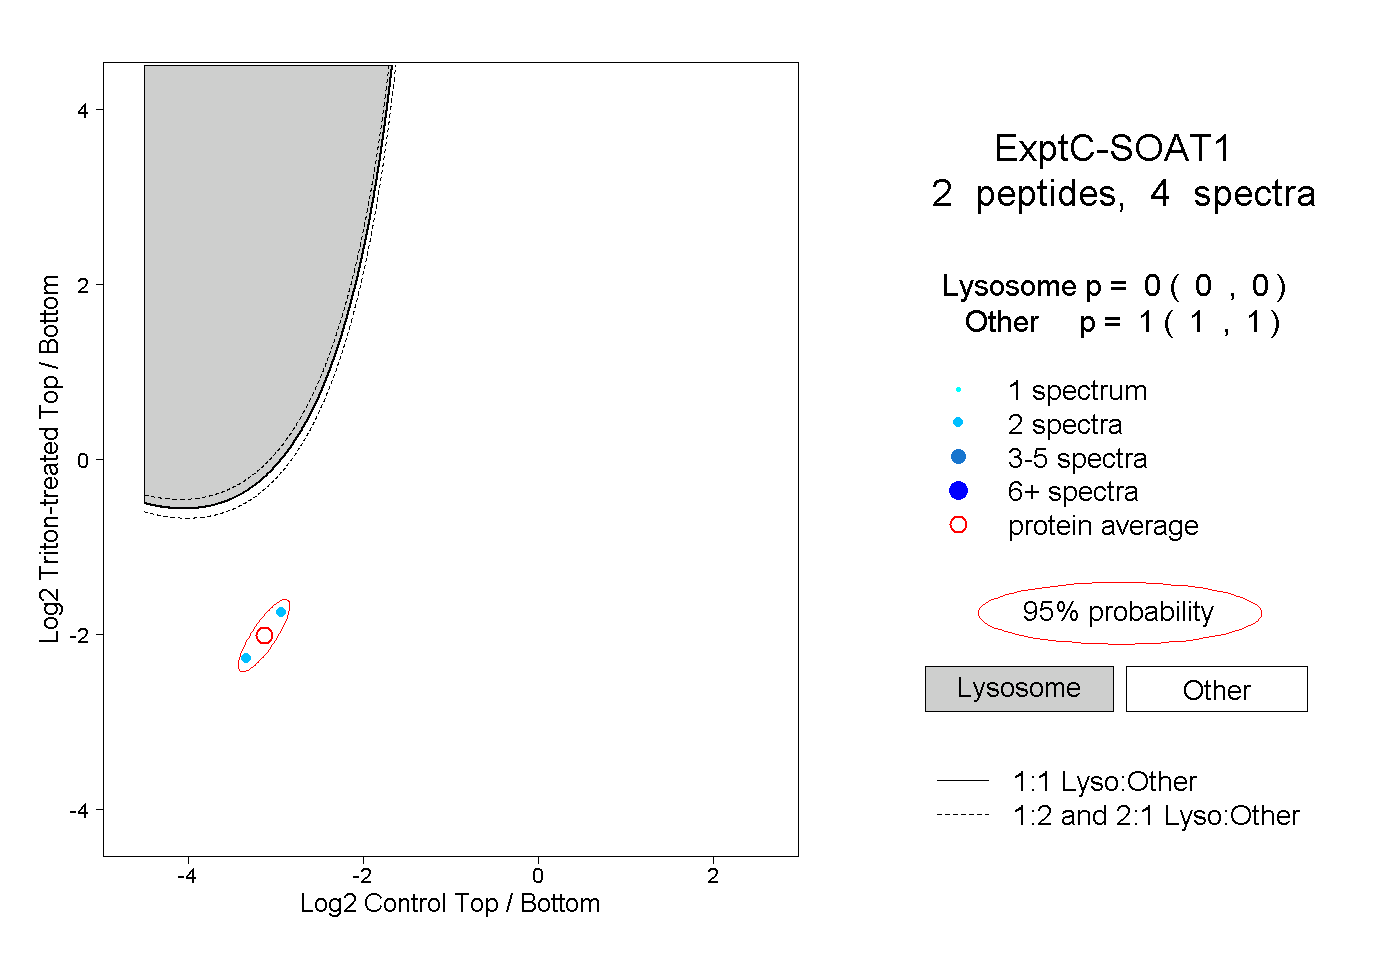
0.000 | 0.000
1.000 | 1.000
| Plot | Mito | Lyso | Perox | ER | Golgi | PM | Cytosol | Nucleus | |||||
| Expt A |
2 peptides |
5 spectra |
|
0.019 0.000 | 0.049 |
0.000 0.000 | 0.000 |
0.009 0.000 | 0.043 |
0.672 0.598 | 0.727 |
0.000 0.000 | 0.000 |
0.205 0.121 | 0.275 |
0.018 0.000 | 0.072 |
0.077 0.042 | 0.096 |
||
| Plot | Lyso | Other | |||||||||||
| Expt C |
2 peptides |
4 spectra |
|
0.000 0.000 | 0.000 |
1.000 1.000 | 1.000 |