 3
3peptides
spectra
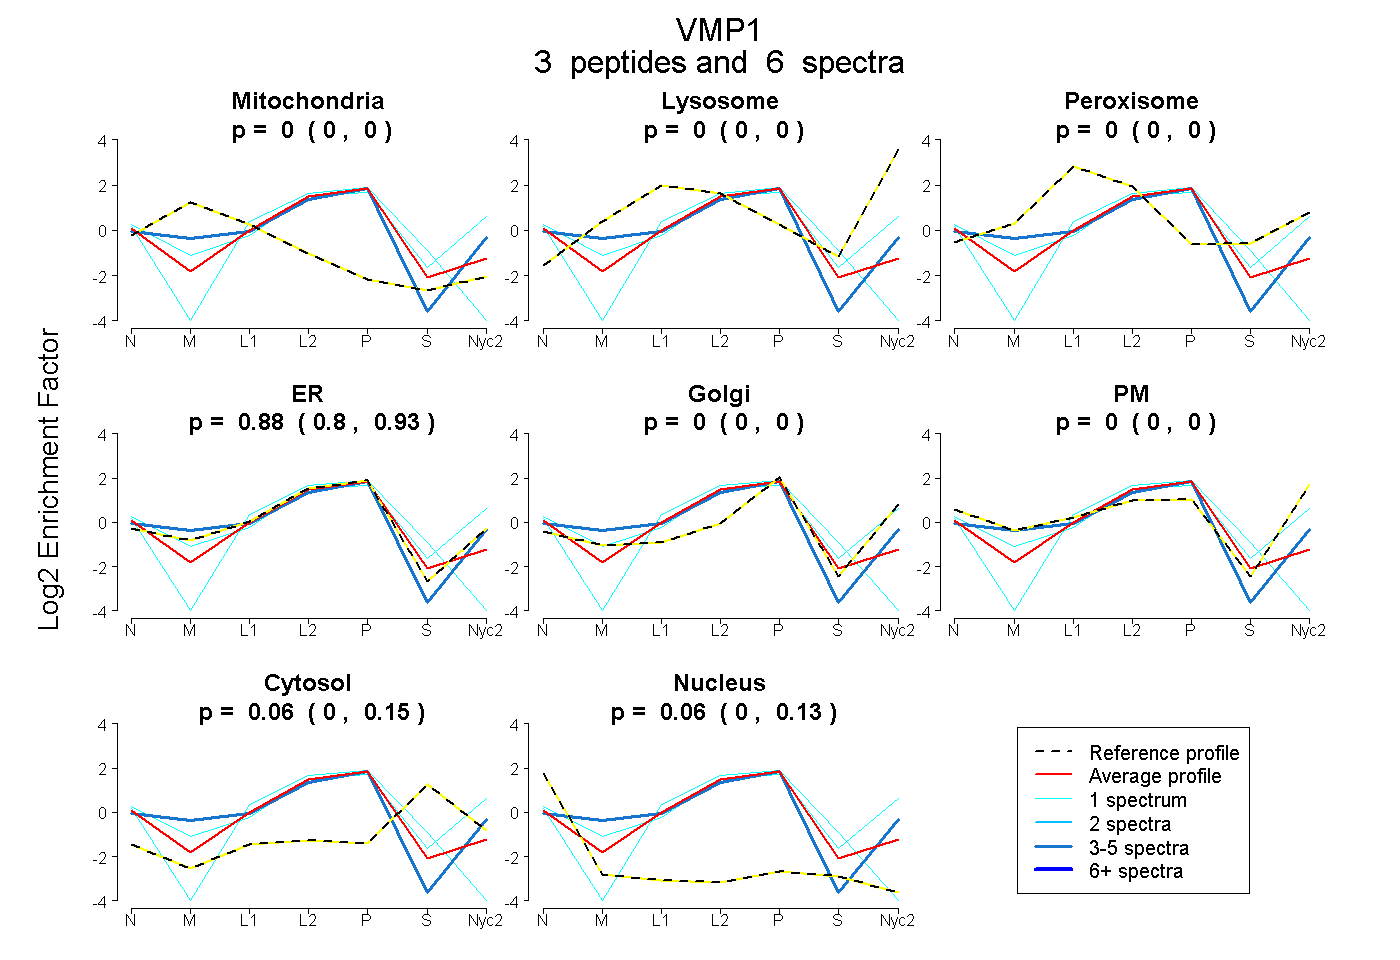
0.000 | 0.000
0.000 | 0.000
0.000 | 0.000
0.805 | 0.928
0.000 | 0.000
0.000 | 0.000
0.000 | 0.151
0.000 | 0.130
| Plot | Mito | Lyso | Perox | ER | Golgi | PM | Cytosol | Nucleus | |||||
| Expt A |
3 peptides |
6 spectra |
|
0.000 0.000 | 0.000 |
0.000 0.000 | 0.000 |
0.000 0.000 | 0.000 |
0.881 0.805 | 0.928 |
0.000 0.000 | 0.000 |
0.000 0.000 | 0.000 |
0.055 0.000 | 0.151 |
0.064 0.000 | 0.130 |
| 4 spectra, QNIVLWR | 0.053 | 0.000 | 0.000 | 0.925 | 0.000 | 0.022 | 0.000 | 0.000 | ||
| 1 spectrum, LNSEEK | 0.000 | 0.000 | 0.000 | 0.522 | 0.000 | 0.385 | 0.092 | 0.000 | ||
| 1 spectrum, EQHNGSFTDPSSVNEK | 0.000 | 0.000 | 0.000 | 0.657 | 0.000 | 0.000 | 0.186 | 0.157 |
| Plot | Mito | Lyso or Perox | ER | Golgi | PM | Cytosol | Nucleus | ||||||
| Expt B |
1 peptide |
2 spectra |
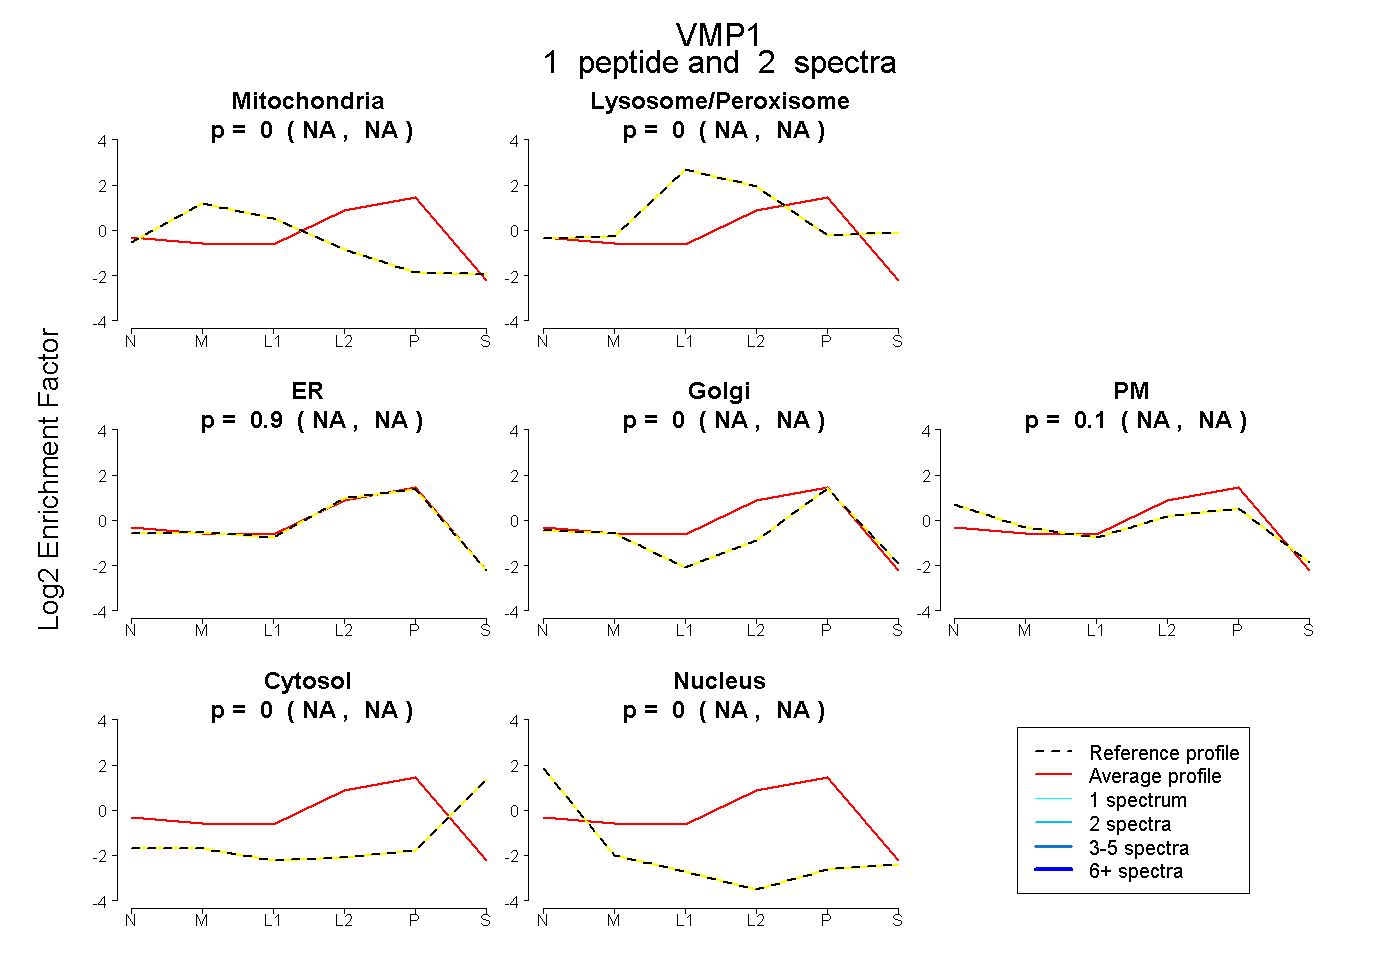 |
0.000 NA | NA |
0.002 NA | NA |
0.896 NA | NA |
0.000 NA | NA |
0.102 NA | NA |
0.000 NA | NA |
0.000 NA | NA |
|||
| Plot | Lyso | Other | |||||||||||
| Expt C |
2 peptides |
10 spectra |
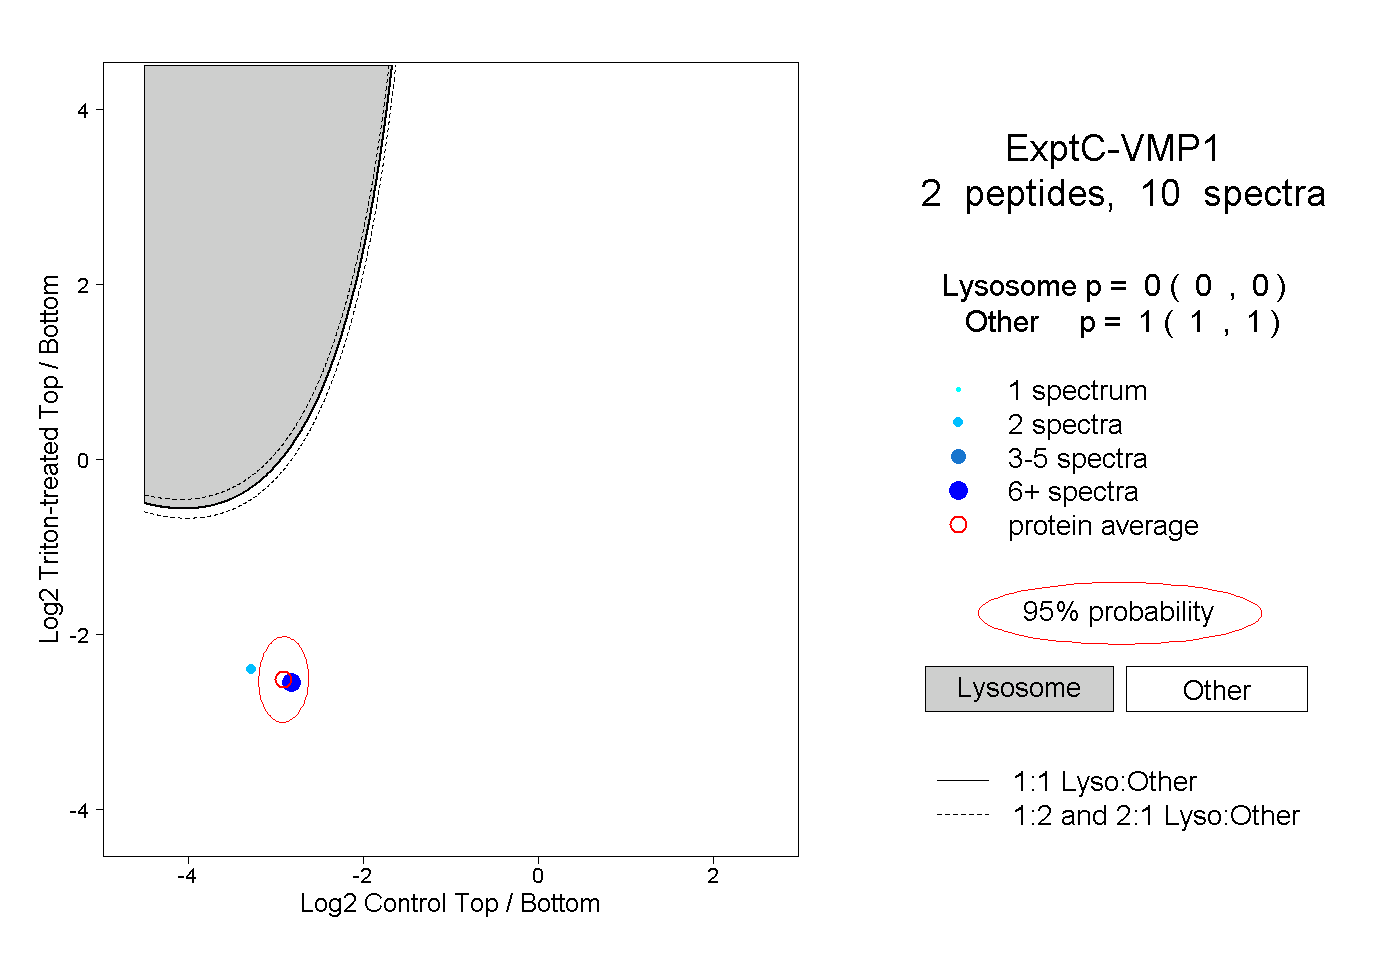 |
0.000 0.000 | 0.000 |
1.000 1.000 | 1.000 |